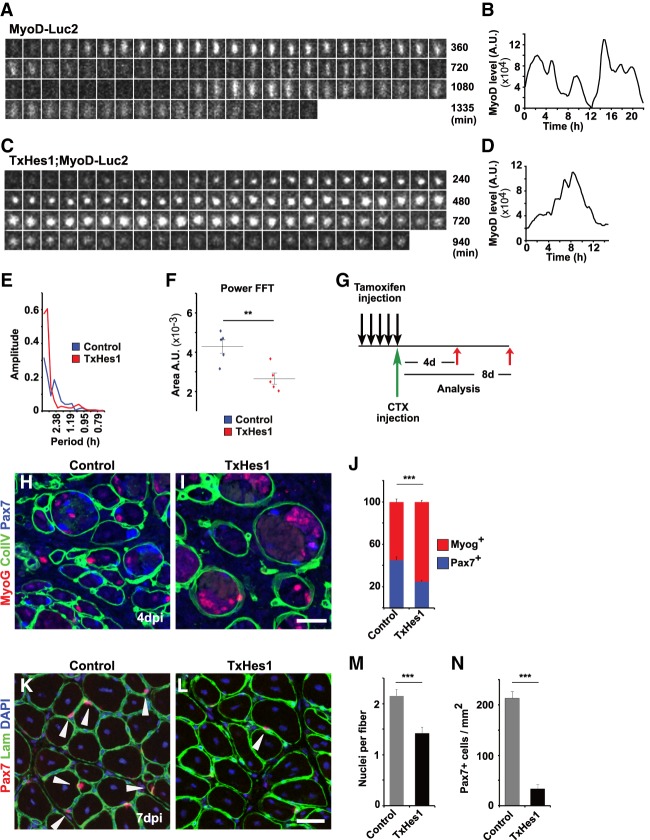
Figure 6.
Unstable MyoD oscillations caused by Hes1 mutation result in increased differentiation of muscle stem cells in vivo. (A,B) Dynamics of bioluminescence in a muscle stem cell from a MyoD-Luc2 animal in muscle tissue explant culture and quantification of the bioluminescence signal. (C,D) Dynamics of bioluminescence in a muscle stem cell from a TxHes1;MyoD-Luc2 animal in muscle tissue explant culture, and quantification of the bioluminescence signal. (E) Fourier transformation of bioluminescence signals in muscle stem cells observed in cultured fibers; the fibers were obtained from control and TxHes1 mutant mice, respectively, and are displayed in A and C. (F) The power was analyzed by measuring the area under the fast Fourier transform (FFT). Data are presented as dot plots and also show the mean (control n = 5; TxHes1 n = 5). (G) Outline of the regeneration experiment shown in H–N. The Hes1 mutation was introduced by tamoxifen in 3- to 4-mo-old animals, and the muscle was injured on the last day of tamoxifen treatment. (H,I) Immunohistological analysis of muscle from control and TxHes1 mutant mice 4 d after injury using antibodies against Pax7, MyoG, and collagen IV. (J) Quantification of the relative proportions of Pax7+ and MyoG+ cells in the regenerating muscle. (K,L) Immunohistological analysis of muscle from control and TxHes1 mutant mice 8 d after injury using antibodies against Pax7 and laminin (Lam). DAPI was used as counterstain. Arrowheads point to Pax7+ cells. (M) Quantifications of muscle fiber nuclei in control and TxHes1 mutant mice 8 d after injury (n = 3, mean ± SEM). (N) Quantification of Pax7+ cells/mm2 in muscle from control and TxHes1 mutant mice 8 d after injury (n = 3, mean ± SEM). Scale bars: (I,L) 30 µm. For statistical analysis, unpaired two-tailed Student's t-test was performed. (**) P < 0.01; (***) P < 0.001. n.s., nonsignificant.

