
Figure 3:
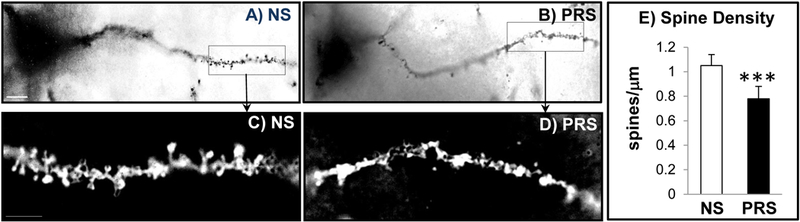
Prenatal stress (PRS) induces reduction of dendritic spines on mPFC neurons. A and B are representative photomicrographs of dendritic spines of pyramidal neurons from mPFC of NS and PRS mice (PND75). C and D are the magnified views of boxed areas in A and B. E is the bar diagram showing quantification of dendritic spine density in mPFC of adult NS and PRS mice. Values are the mean ± SEM. ***p < 0.001, N=5 mice for each group. Scale bars in A and B, 10μm; in C and D, 5μm).