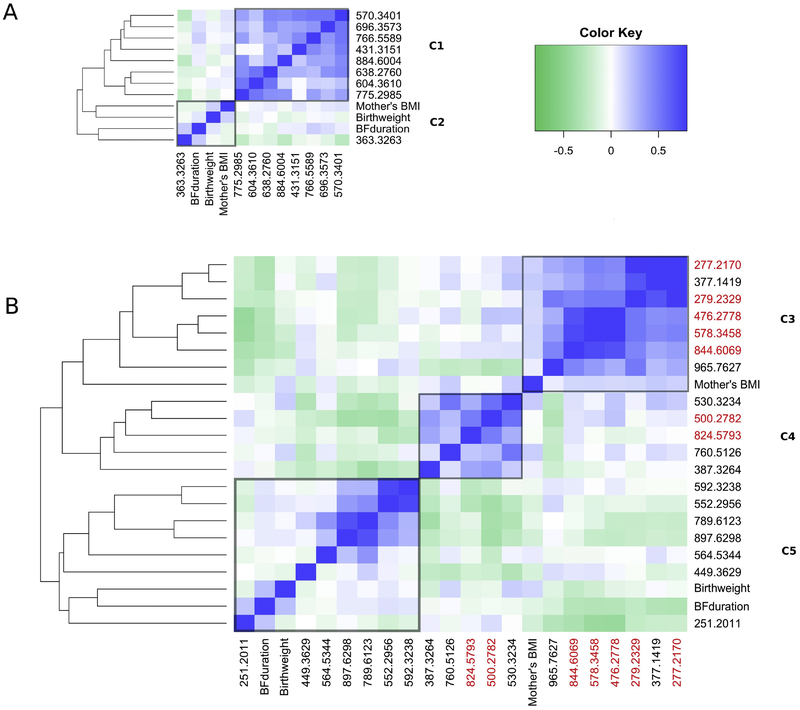
Figure 1.
Agglomerative hierarchical clustering using complete linkage and Spearman correlation (‘hclust’ function in R). Clusters of features predictive of (A) early diagnosis and (B) late diagnosis of ALL, with distinct clusters labeled C1-C6. Metabolites containing 18:2, 18:3 or 20:4 fatty acid chains are highlighted in red.

