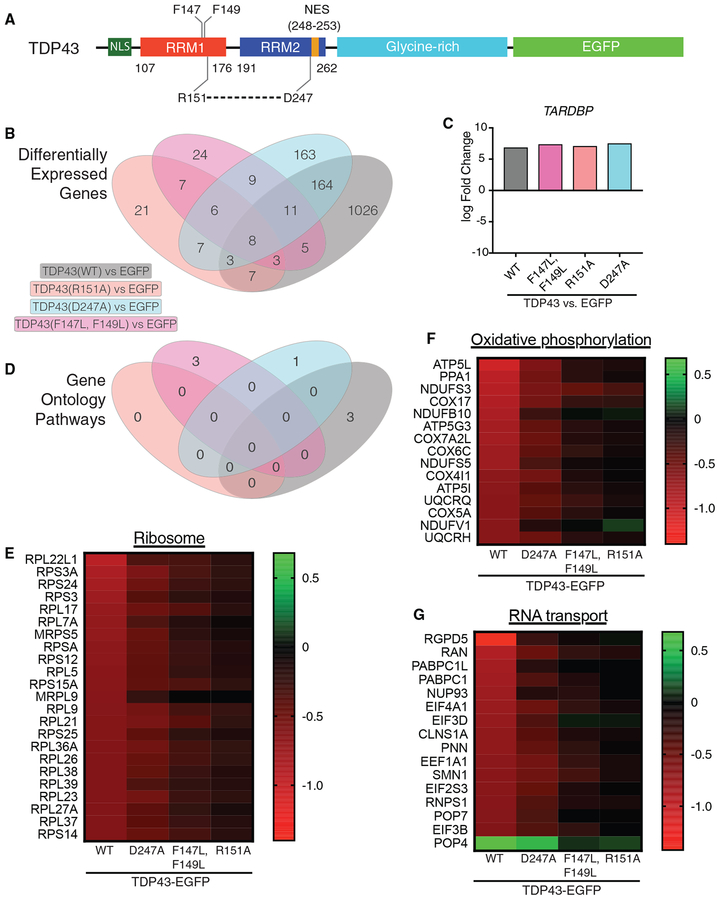
Figure 6. TDP43(WT) Overexpression Selectively Affects Ribosomal and Oxidative Phosphorylation Pathways.
(A) TDP43 schematic depicting variants used for RNA sequencing (RNA-seq).
(B) Venn diagram illustrating differentially expressed genes (DEGs) for each condition, in comparison to EGFP alone.
(C) TARDBP transcript levels were similar among all TDP43 variants, demonstrating equivalent overexpression in each case.
(D) Venn diagram showing significant enrichment for functional pathways according to GO analysis.
(E–G) Among downregulated mRNAs, transcripts involved in the ribosomal (E) and oxidative phosphorylation (F) pathways were highly enriched (FDR = 6.8 × 10⁻⁵ and 0.03, respectively), with a trend toward enrichment for transcripts related to RNA transport (G, FDR = 0.222).

