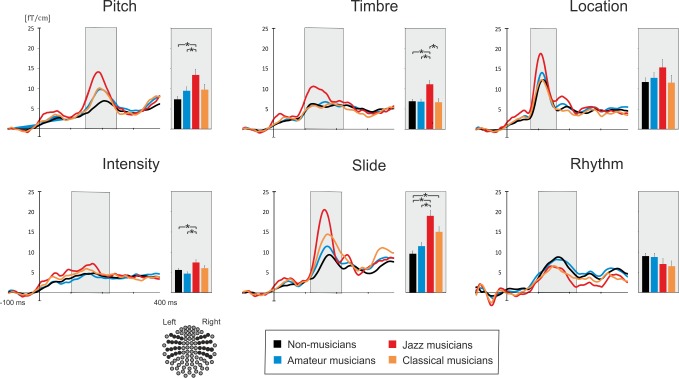
Fig 3. Average areal mean curves and MMNm amplitudes obtained for each musical group and six types of deviants.
Histograms represent mean values of MMNm responses. Asterisks mark significant results of Bonferroni-corrected planned comparisons (p < 0.05). A schematic picture of the gradiometers selected for calculating areal mean curves (dark circles) is at the bottom left.

