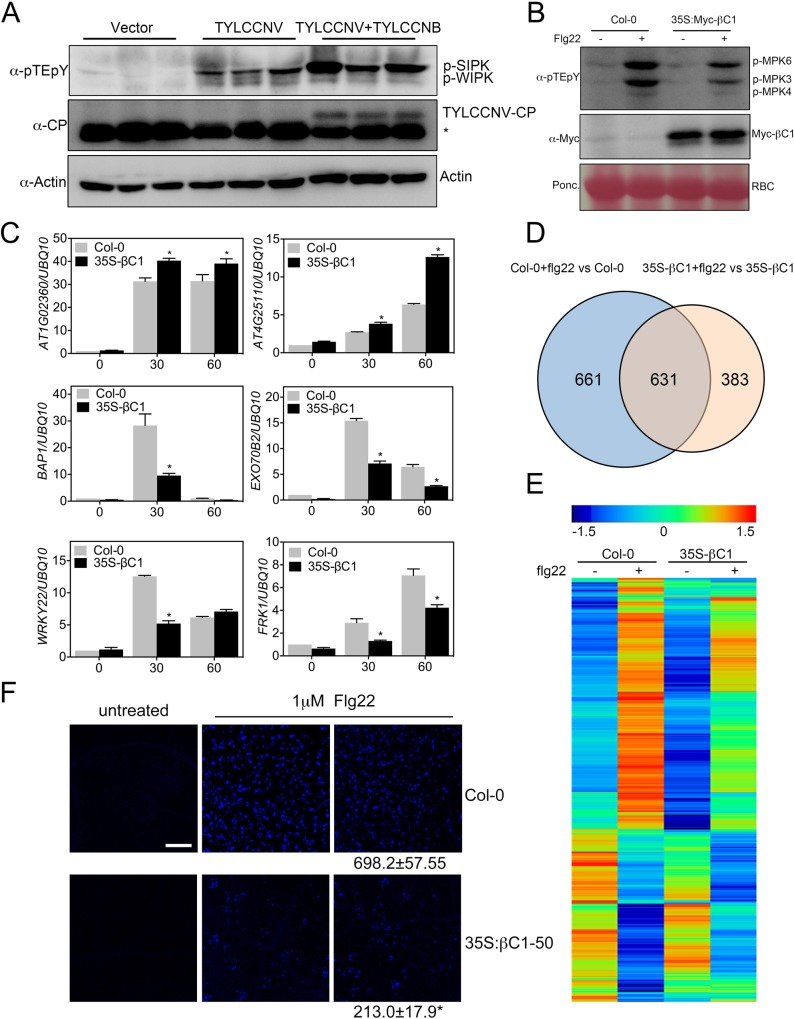
Fig 2. βC1 inhibits the MAPK cascade that is activated by virus infection.
(A) MAPK activation in mock infiltrated and virus-infiltrated N. benthamiana. Seven-leaf-stage N. benthamiana plants were infiltrated with Agrobacterium harboring empty vector, TYLCCNV and TYLCCNV with TYLCCNB. Systemic leaves were collected seven days post infiltration. Endogenous phosphorylated NbSIPK and NbWIPK were monitored by immunoblot with an anti-pTEpY antibody. Virus accumulation was detected by a TYLCCNV-CP antibody. Actin protein serves as a loading control. The asterisk (*) indicates cross-reaction band. (B) Flg22-induced MAPK activation in Col-0 and 35S-Myc-βC1. 10-day seedlings were treated with 100 nM flg22 for 15 min and subjected to immunoblot assays with an anti-pTEpY or anti-Myc antibody. Ponceau S staining of Rubisco (RBC) shows protein loading. Numbers indicate the average ratio of phosphorylated MPK6 and MPK3 protein in 35S-Myc-βC1 transgenic plants compared wild type for four biological replicates, asterisks represent statistically significant based on Student’s t test at P < 0.05. (C) RT-qPCR analysis of Flg22-induced expression of selected marker genes in the MAPK pathways in Col-0 and 35S-Myc-βC1. Ten-day-old seedlings were treated with 1μM flg22 for 30 and 60 min. The asterisk (*) indicates significant differences with a Student’s t test (P < 0.05). (D) Venn diagram of flg22-regulated genes (fold change ≥2 and P value < 0.05) in Col-0 and 35S-Myc-βC1 (100 nM flg22 treatment for 30 min). (E) Heat map of flg22-regulated genes in Col-0 and 35S-Myc-βC1 transgenic plants with or without flg22 treatment. Hierarchical clustering was analyzed with the average linkage method using MeV. Red color to blue color indicates expression level from relatively high to low. (F) βC1 attenuates flg22 induced callose deposition. Flg22-induced callose deposition in Col-0 and 35S-Myc-βC1 transgenic plants. Ten-day-old Arabidopsis seedlings were treated with 1μM flg22 for 24h. Callose deposition was analyzed after 4-hour Aniline blue staining. Bars represent 0.1 mm. The number below each microscopy photograph indicates the average number and standard error of mean of callose deposits. The results are a representative of five independent experiments. Asterisk represents statistically significant based on Student’s t test at P < 0.05.

