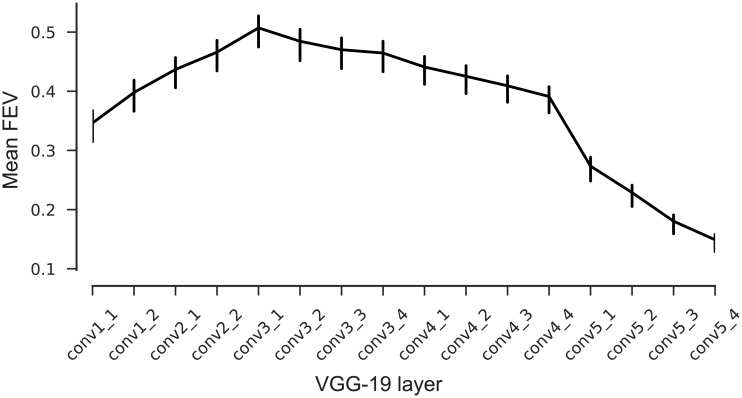
Fig 4. Model performance on test set.
Average fraction of explainable variance explained (FEV) for models using different VGG layers as nonlinear feature spaces for a GLM. Error bars show 95% confidence intervals of the population means. The model based on layer conv3_1 shows on average the highest predictive performance.

