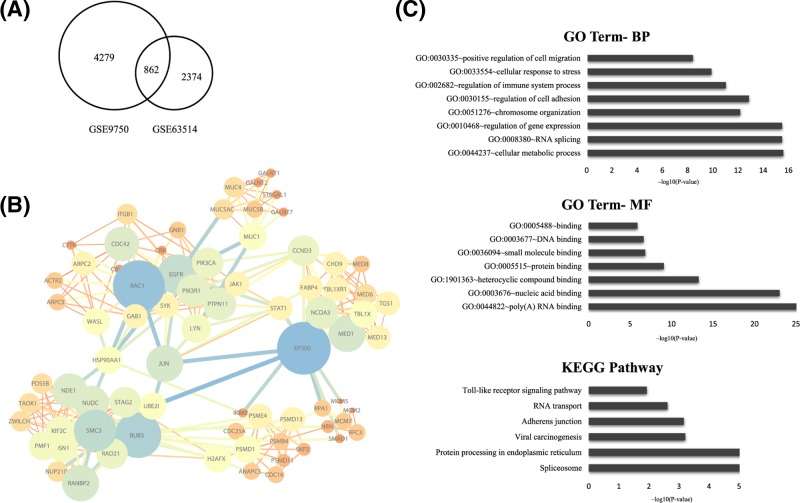
Figure 1. Bioinformatics analysis of DEGs.
(A) Flowchart of bioinformatics analysis. 862 integrated DEGs between two groups were chosen as the final DEGs. (B) PPIs network of DEGs. DEGs in the PPI networks with a connectivity degree >20 and with the combination score >0.9 were represented, of which the top 8 high-interaction score genes were identified as real hub genes. (C) Go analysis of DEGs showed the significantly over-represented biological processes, molecular function of DEGs, and KEGG pathway enrichment of DEGs showed the significantly over-represented pathways in DEGs.

