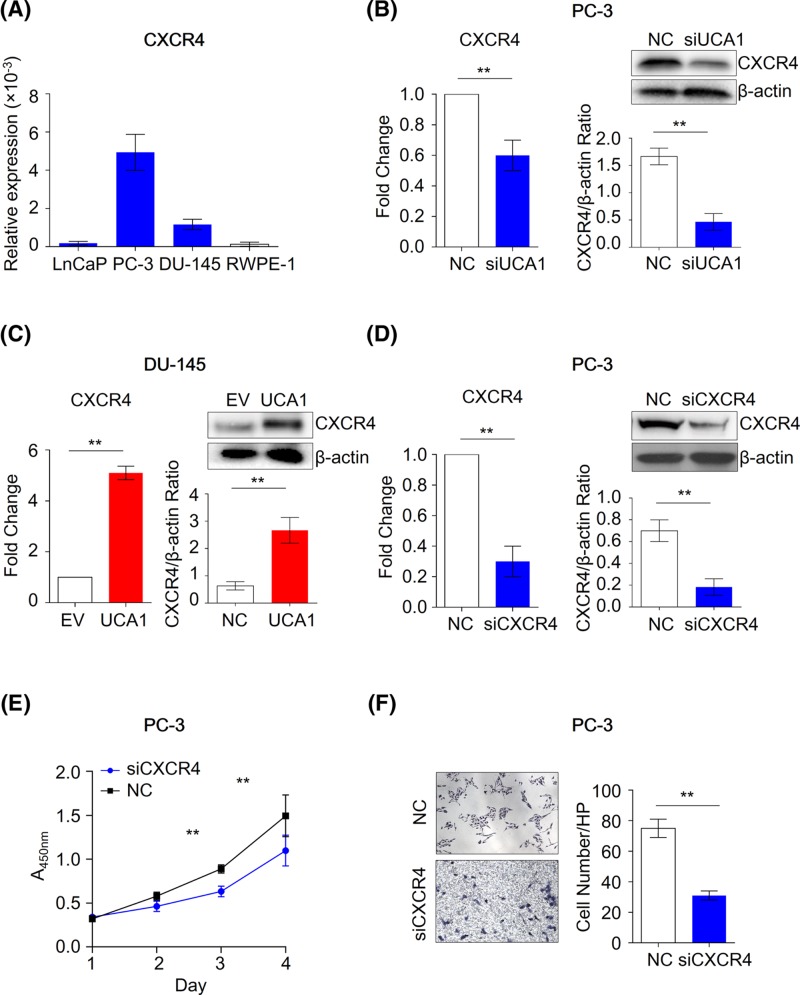
Figure 2. UCA1 regulates CXCR4 expression in PCa cells.
(A) The expression level of CXCR4 in normal prostate epithelial cell line RWPE-1 and PCa cell lines LnCaP, PC-3 and DU-145 cells (n = 3). **P<0.01,Mann-Whitney U test was used to compare PCa cells and normal cells. (B) The mRNA (left figure) and protein (right figure) level of CXCR4 in NC and UCA1 knockdown PC-3 cells (n = 3). **P<0.01,Mann-Whitney U test was used to compare NC cells and UCA1 knockdown cells. (C) The mRNA (left figure) and protein (right figure) level of CXCR4 in the control (NC) and UCA1 overexpression DU-145 cells (n = 3). **P<0.01, Mann–Whitney U test was used to compare NC cells and UCA1 overexpression cells. (D) The mRNA (left figure) and protein (right figure) level of CXCR4 in the control (NC) and CXCR4 knockdown PC-3 cells (n=3). **P<0.01, Mann–Whitney U test was used to compare NC cells and CXCR4 knockdown cells. (E) The CCK-8 assay (n=6) and (F) transwell-matrigeal assay (n=3) was performed to evaluate the biological effect of CXCR4 knockdown in PC-3 cells. **P<0.01, Mann–Whitney U test was used to compare NC cells and CXCR4 knockdown cells.

