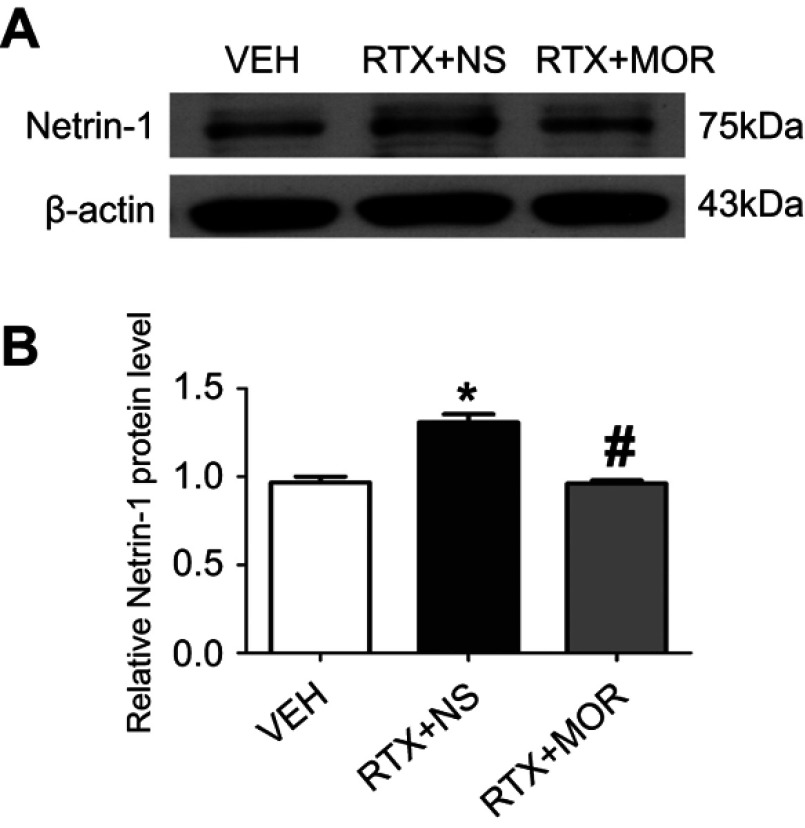
Figure 6.
Effect of morphine on Netrin-1 protein levels in SH-SY5Y cells. (A) Representative gel images show the protein expression of Netrin-1 in the SH-SY5Y cells obtained from VEH-, RTX + NS-, and RTX + MOR groups. B-actin was used as a loading control. (B) Summary data show the protein level of Netrin-1 in VEH-, RTX + NS and RTX + MOR groups. The abbreviations used are normal saline (NS), vehicle (VEH), RTX + MOR (RTX + morphine). Data are expressed as means ± SEM. *P<0.05, compared with VEH group; #P<0.05, compared with RTX + NS group (n=6 per group).

