
Figure 2a.
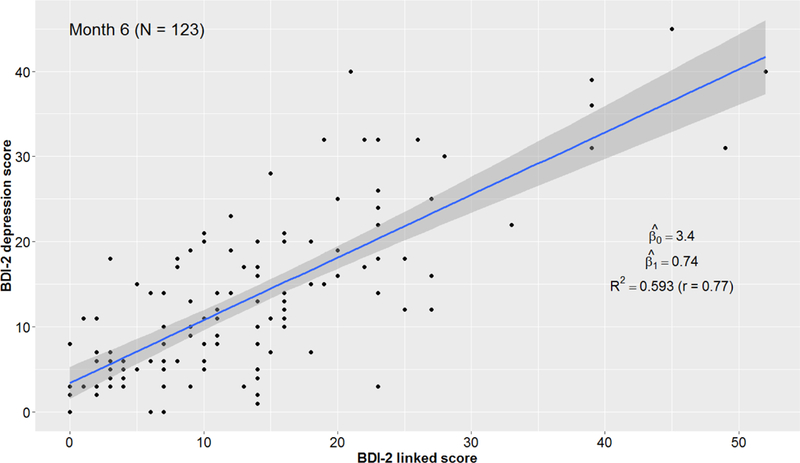
Scatterplot and regression analysis of the association of 6-month BDI-II linked scores, based on PROMIS Depression scores, with 6-month BDI-II observed scores. The gray zone represents the standard error of the regression line.
Official websites use .gov
A
.gov website belongs to an official
government organization in the United States.
Secure .gov websites use HTTPS
A lock (
) or https:// means you've safely
connected to the .gov website. Share sensitive
information only on official, secure websites.
Scatterplot and regression analysis of the association of 6-month BDI-II linked scores, based on PROMIS Depression scores, with 6-month BDI-II observed scores. The gray zone represents the standard error of the regression line.