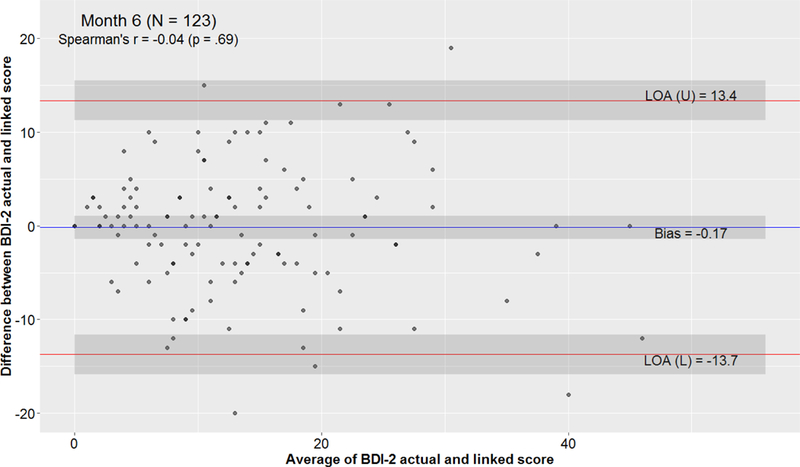
Figure 2b.

Bland-Altman plot comparing observed and linked BDI-II scores at 6 months. The severity of depression is represented on the X-axis as the average of the observed and linked BDI-II scores. Agreement is represented on the Y-axis as the difference between the observed and linked BDI-II scores. The bias line indicates the mean difference between the observed and linked scores; 95% of the differences are expected to fall within the upper and lower limits of agreement (LOA). The Spearman correlation coefficient indicates that there is no linear relationship between the severity of depression and the difference between the observed and linked scores at 6 months.
