
Figure 2c.
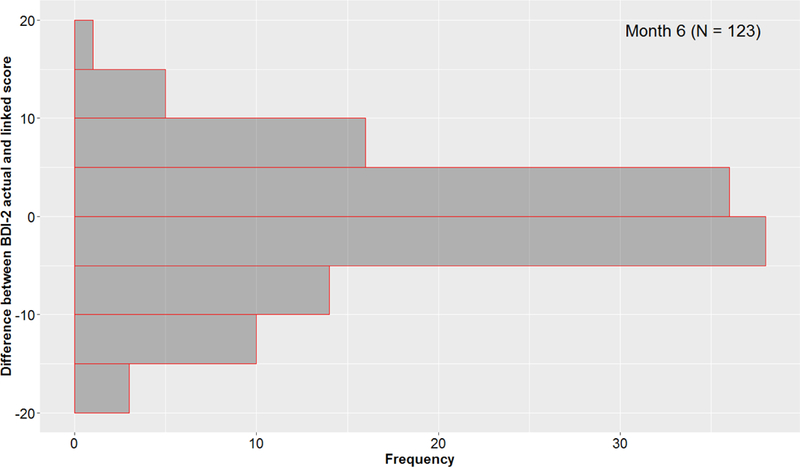
Histogram of differences between 6-month BDI-II observed and linked scores, collapsed over all levels of severity. The vertical axis represents the difference between the scores, the horizontal axis represents the number of participants, and the bars depict 5-point increments along the vertical axis. The graph shows that while extreme within-participant differences between the scores were rare, small-to-moderate differences were common. It also shows that the differences were bidirectional.