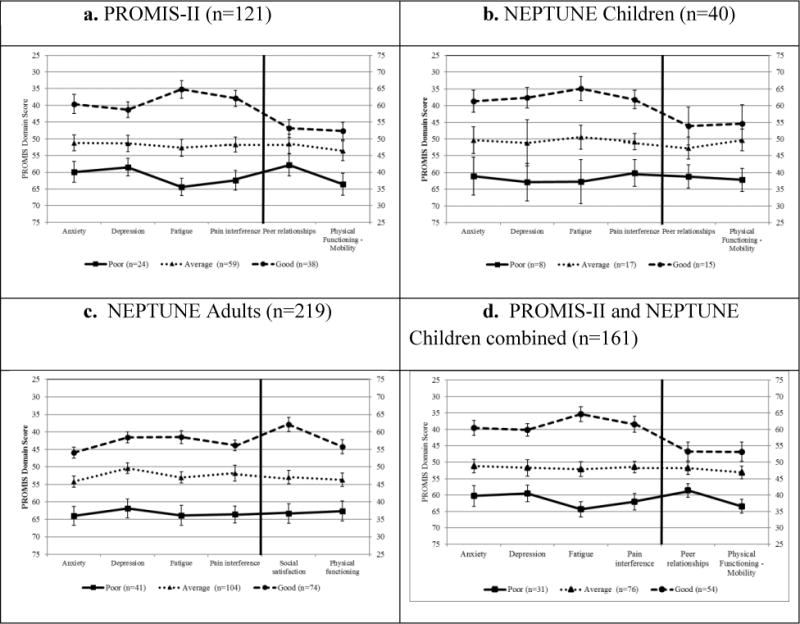
Figure 2. PROMIS domain scores of three latent profiles from by cohort. Mean and 95% confidence intervals are plotted.

*Anxiety, Depression, Fatigue, and Pain interference are plotted using the left Y-axis; Peer relationships and Physical functioning – mobility are plotted using the right Y-axis
