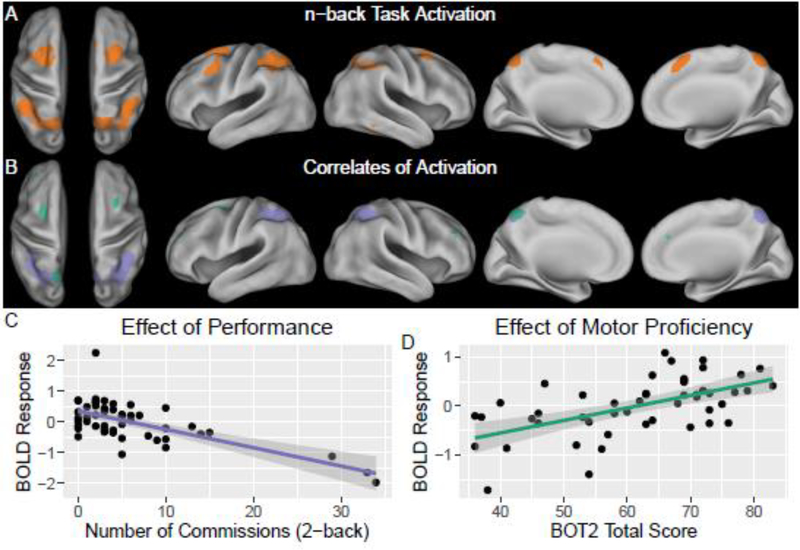
Figure 2. FMRI Findings during N-back Working Memory Task.
(A) Orange overlay shows brain activation during n-back task (contrast: 2-back > 0-back in a random-effects group analysis; p< 0.05 with family-wise error [FWE] correction, minimum cluster size 200 voxels). (B) Neural correlates of performance and motor proficiency. Light purple denotes areas where activity was negatively associated with commission errors during the task (regression: 2-back > 0-back versus commission errors during the 2-back task; p< 0.05 with FWE correction, minimum cluster size 200 voxels). Green overlay shows areas were brain activity was positively associated to motor proficiency (univariate regression: 2-back > 0-back versus BOT2 total scores; p< 0.05 with FWE correction, minimum cluster size 200; clusters drop just below FWE significance (P ~ 0.1) with age in the model but demonstrate consistency across all models examined). (C) Scatter plot of activity versus commission errors at a sub-cluster in the right superior parietal lobule. (D) Scatter plot of activity versus BOT2 scores at cluster in the left superior frontal gyrus.

