
FIGURE 3.
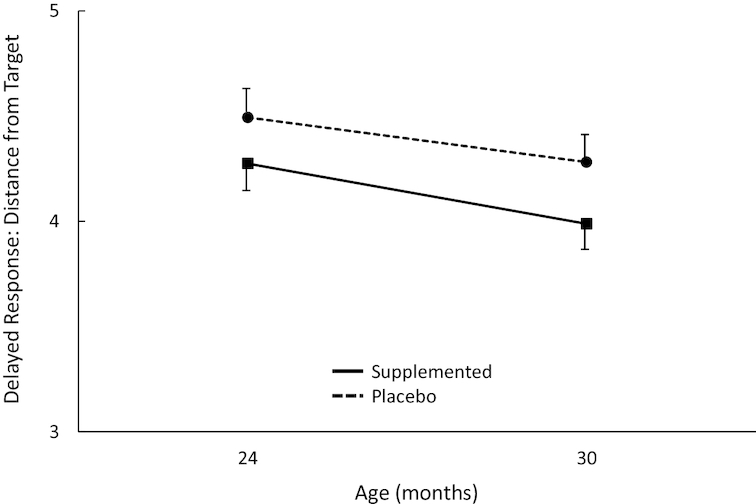
Plot of main effect for DHA group on Delayed Response accuracy across visits. Overall sample sizes are 161 at 24 mo (n = 77 and 84 for placebo and DHA, respectively) and 160 at 30 mo (n = 84 and 85, respectively). All means shown here are adjusted for covariates. The main effect for DHA group was statistically significant (P = 0.047) but was qualified by several significant higher-order interactions. Error bars represent SEMs.