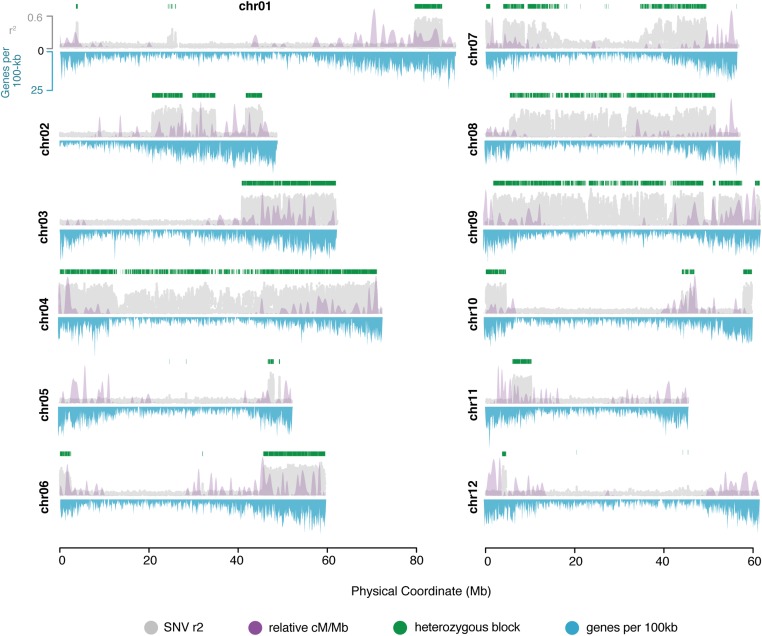
Figure 1.
Recalcitrant residual heterozygous SNVs in a seven-generation inbred. Genome-wide map of local LD based on the mean r2 centered on windows of 100 SNVs (gray) and the coincidence of elevated recombination rates (relative recombination rates, purple overlay). Top y-axis, average r2 per marker. Bottom y-axis, genes per 100 kb (blue). Green blocks, regions with elevated LD, heterozygous blocks in M6. chr, chromosome; LD, linkage disequilibrium; SNV, short nucleotide variant.

