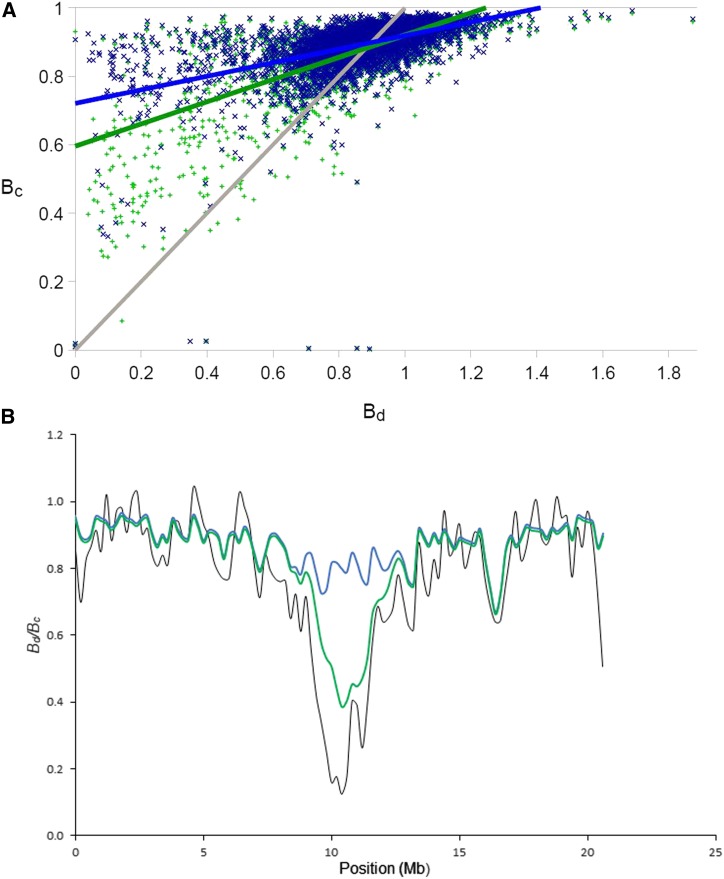
Figure 2.
(a) Genome-wide correlation between (the modeled deviation from neutral diversity) and (B calculated from data) under two different linked-selection models. The gray line marks identity for better orientation. Colored lines are linear regressions with blue showing only background selection (model 1), and green showing BGS and recent sweeps (model 2). (b) A comparison between (black) and calculated with BGS (model 1, blue line) and BGS plus recent sweeps (model 2, green), with , α = 1 for chromosome 12. BGS, background selection.

