Figure 3.
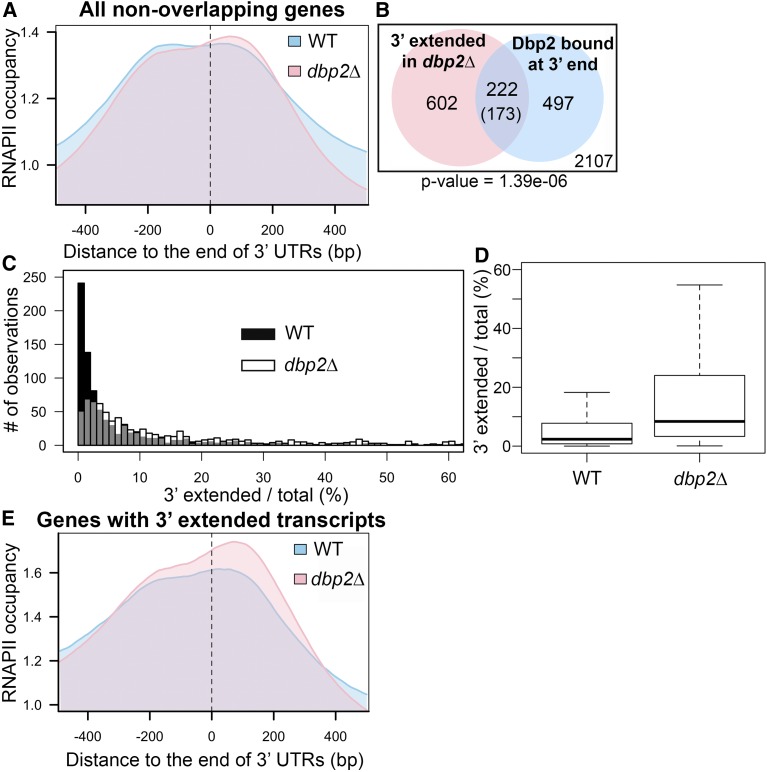
Loss of DBP2 causes termination defects at a subset of protein-coding genes. (A) Meta-analysis of normalized RNAPII occupancy at the 3′ ends of all protein-coding genes in wild-type and dbp2∆ cells. Only transcripts without overlapping genes within 150 bp downstream in the sense direction were considered in the analysis. The 0 position and dotted line marks the location of the polyadenylation site (Nagalakshmi et al. 2008; Yassour et al. 2009). (B) Venn diagram showing the intersection between 3′ extended transcripts in dbp2∆ and mRNAs bound by Dbp2 at the 3′ end (50 nt of ORF 3′ end through the 3′ UTR). Aberrant transcripts were identified following RNA-seq of wild-type and dbp2∆ strains by an overaccumulation of reads mapping within 150 nt downstream of the 3′ UTR, after accounting for different expression levels between wild-type and dbp2∆ strains. The number in the parentheses is the expected value of intersection if the two groups of transcripts have no significant correlation. The number within the white square corresponds to genes that lack both detectible, putative read-through products in dbp2∆ and Dbp2 binding on mRNA 3′ ends. The P-value derived from a one-sided Fisher’s exact test is shown. (C) Loss of DBP2 results in differential accumulation of 3′ extended products for individual genes. Histograms illustrating the percentage of total transcripts corresponding to 3′ extended products in dbp2∆ or wild-type cells as determined by read counts in the extended region over the counts in the ORF in wild-type and dbp2∆ cells multiplied by 100. Gray coloring denotes overlap between the histogram of wild type and dbp2∆. (D) Loss of DBP2 results in a broader distribution of 3′extended transcripts as compared to wild-type cells. A box plot showing the quartile distribution of the ratio of extended vs. total transcript in wild-type and dbp2∆ cells. The distributions of the two strains is significantly different, as tested by the two sample Kolmogorov–Smirnov test (P-value <2.2e−16). (E) Protein-coding genes that produce 3′ extended transcripts show RNAPII accumulation in dbp2∆ cells at downstream of annotated 3′ UTRs. Meta-analysis of RNAPII occupancy across the 824 genes with 3′ extended transcripts in dbp2∆ RNA-seq. WT, wild type.

