. 2019 Apr 24;8:e45252. doi: 10.7554/eLife.45252

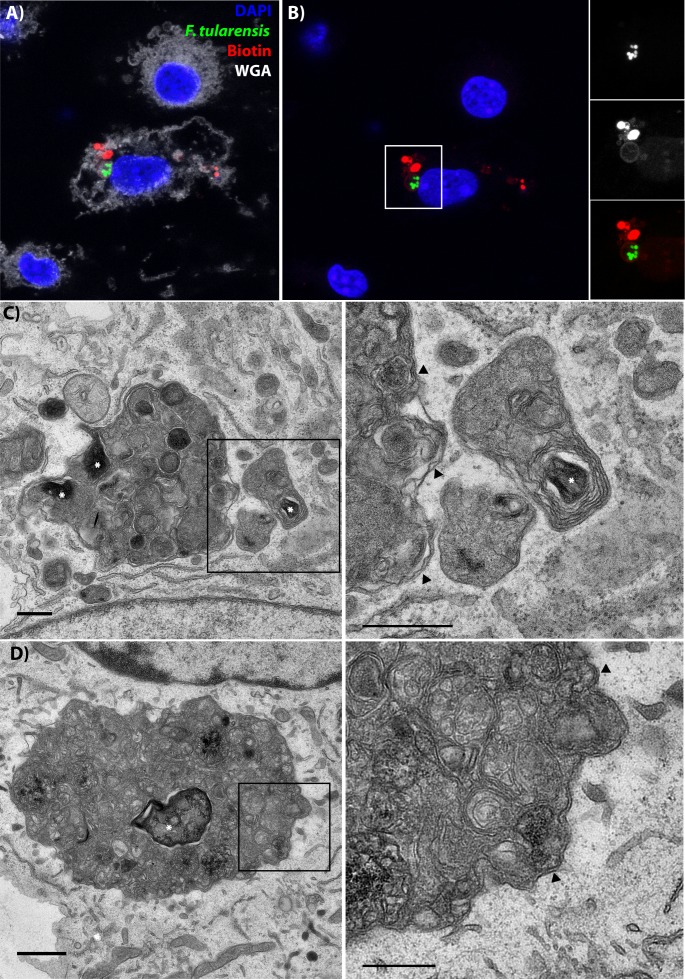
Figure 5. Following cell-cell transfer, Francisella is enclosed within a multi-membraned vacuole with one membrane originating from the donor plasma membrane.

(A) Representative image of a recipient cell following bacterial transfer. The plasma membrane of the initially infected donor cell was labelled with biotin and the purified recipient cells were permeabilized and stained with fluorescent streptavidin (red). (B) The same image as panel A without the wheat germ agglutinin staining for the plasma membrane. The images on the right are higher magnifications of the white box. An example donor cells is depicted in Figure 5—figure supplement 3 (C–D). Two representative transmission electron micrograph images of inducible T6SS bacteria inside of double membrane structures in purified recipient cells. The images on the right are higher magnifications of the boxed region for each respective image. Arrows denote double membranes, white stars denote bacteria. The scale bars are all 500 nm. Sequential slices and related structures in the same cell for Panel C are available in Figure 5—figure supplement 6.

Figure 5.

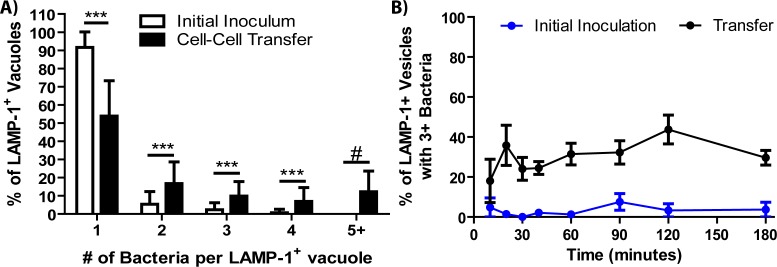
Figure 5—figure supplement 1. Vacuoles containing several bacteria form following cell-cell transfer.

Figure 5—figure supplement 1.

(A) The percent of LAMP-1 positive vacuoles containing the indicated number of F. tularensis bacteria. The white bars represent phagocytosis of extracellular bacteria in a conventional infection. (B) The percentage of vacuoles with three or more bacteria in the same LAMP-1 positive vacuole over time. three independent experiments with 50 infected cells analyzed per experiment per time point. Panel A is derived from a combination of all time points in panel B. Mean ±the standard deviation. Student t-test. ***p<0.001. There were no bacteria in the initial inoculum sample with 5 + bacteria in Panel A after 1200 cells were analyzed across three experiments. For that sample, # is meant to call attention to the vast difference between the samples since a t-test cannot be performed.
Figure 5—figure supplement 2. Formation of FCVs in the F. tularensis Schu S4 strain.
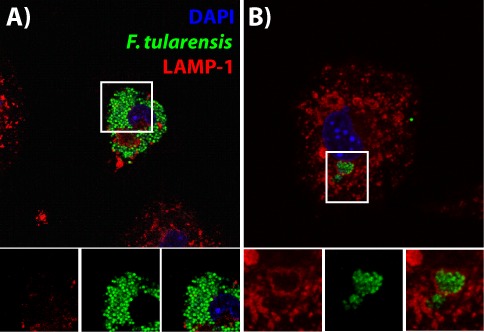
Figure 5—figure supplement 2.

(A) A representative donor BMDM infected with Schu S4. (B) A representative recipient BMDM 2 hr after cell-cell transfer. The images below the panel are higher magnifications of the region in the white box.
Figure 5—figure supplement 3. Representative images of donor cells in membrane transfer assays.
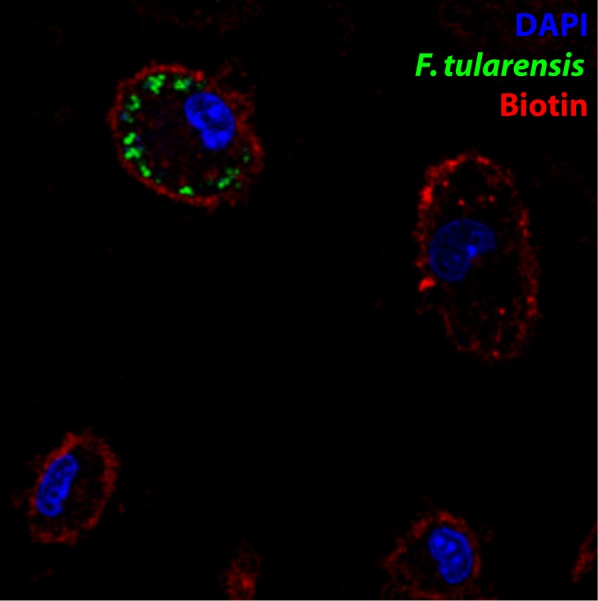
Figure 5—figure supplement 3.

A representative infected donor cell where proteins on the plasma membrane were biotinylated and stained with fluorescent streptavidin (red). These are the control cells for Figure 5A/B.
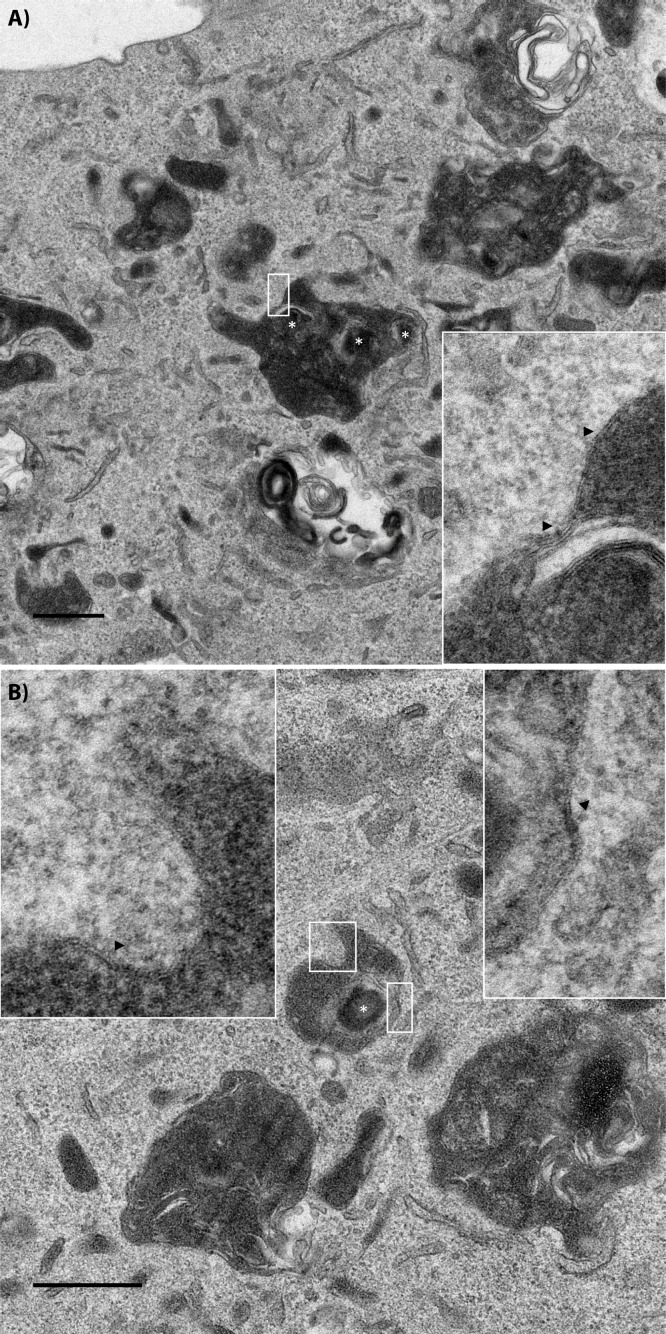
Figure 5—figure supplement 4. Transmission electron micrograph of a recipient BMDM that acquired wildtype bacteria.

Figure 5—figure supplement 4.

Two examples of wildtype bacteria in FCVs inside of recipient cells. The insets are higher magnification images of the region denoted in the white boxes. Black arrows point to double membrane regions on the membrane. Wildtype bacteria are labelled with a white asterisk. The scale bar represents 500 nm for the low magnification image.
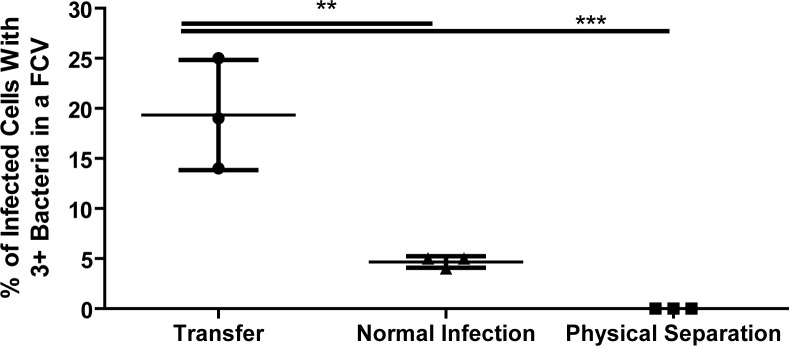
Figure 5—figure supplement 5. FCVs containing several bacteria require cell-cell contact.

Figure 5—figure supplement 5.

The percent of infected cells that contained a LAMP-1 positive FCV with three or more bacteria in the same vacuole. The cell-cell transfer and physical separation (Transwell) samples were purified recipient cells exposed to donor cells for 30 min. The normal infection samples were BMDMs that had been infected with F. tularensis for 20 hr. Mean ± standard deviation. Each data point represents an experiment. three independent experiments with 100 infected cells (cell-cell transfer), 100 infected cells (normal infection) or 25 infected cells (physical separation) per experiment. One-way ANOVA with Dunnett post-test. **p<0.01, ***p<0.001.
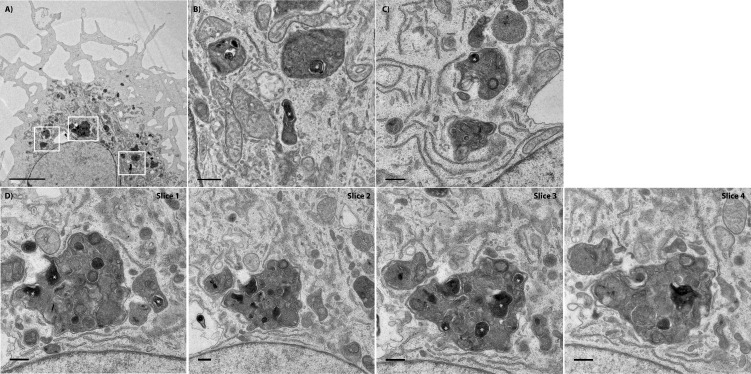
Figure 5—figure supplement 6. Transmission electron micrograph of a recipient BMDM that acquired several bacteria.

Figure 5—figure supplement 6.

(A) A low magnification of the recipient BMDM depicted in Figure 5. The scale bar represents 5 μm. (B) A higher magnification of the white box on the far right. This image depicts at least two bacteria in separate vacuoles within the recipient cell. (C) A higher magnification of the white box on the far left. (D) A series of sequential stacks of the white box in the middle. This large vacuole contains at least six bacteria acquired from the donor cell. The scale bars for panels B-D represent 500 nm. White asterisks denote F. tularensis bacteria. The first slice is the same image as Figure 5 Panel C.