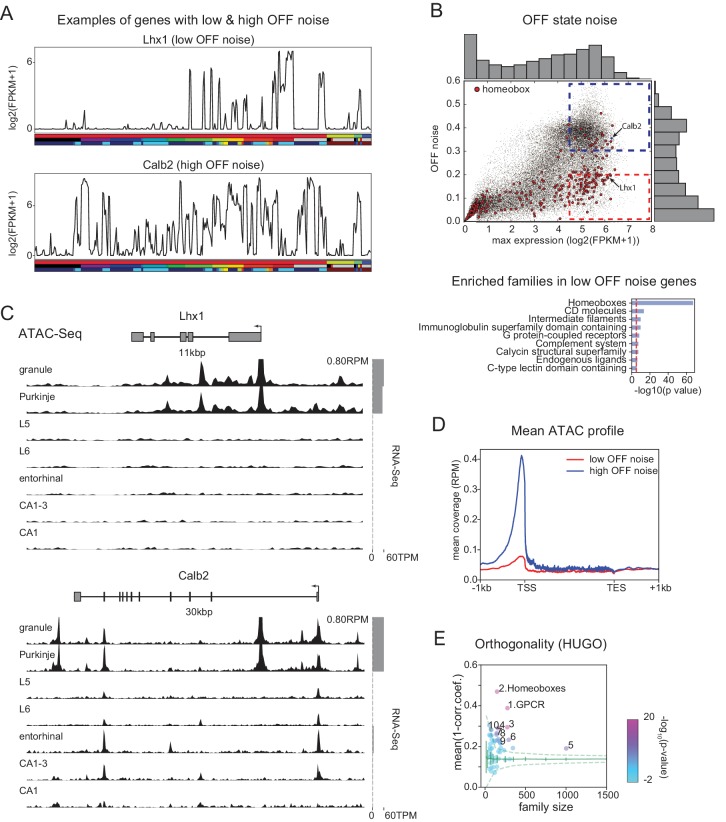
Figure 5. Mechanisms contributing to low noise and high information content of homeobox TFs.
(A) Example expression patterns of a LIM class homeobox TF (Lhx1) and a calcium binding protein (Calb2) with similar overall expression levels. Sample key as in Figure 1—figure supplement 1–3. (B) (upper) OFF state noise (defined as standard deviation (std) of samples with FPKM<1) plotted against maximum expression. (lower) HUGO gene groups enriched in the region indicated by red dashed box in the upper panel (see Figure 5—figure supplement 1 for PANTHER and Gene Ontology enrichments). (C) Average (replicate n = 2) ATAC-seq profiles for the genes shown in A. Some peaks are truncated. Expression levels are plotted at right (gray bars). (D) Length-normalized ATAC profile for genes with high ( 0.3, blue dashed box in B, n = 853) and low ( 0.2, red dashed box in B, n = 1643) OFF state expression noise. (E) Each circle represents the orthogonality of expression patterns calculated using HUGO gene groups. Orthogonality is a measure of the degree of non-redundancy in a set of expression patterns. Since the dispersion of orthogonality depends on family size, results are compared to orthogonality calculated from randomly sampled groups of genes (green solid lines: mean and Std. Dev.; green dashed lines: 99% confidence interval). Families, Z-scores, family size: 1. GPCR: 17.1, n = 277; 2. Homeoboxes: 16.6, n = 148; 3. Ion channels: 10.7, n = 275; 4. C2 domain containing: 7.8, n = 159; 5. Zinc fingers: 6.9, n = 1002; 6. Immunoglobulin superfamily domain containing: 6.7, n = 292; 7. PDZ domain containing: 6.3, n = 144; 8. Fibronectin type III domain containing: 5.9, n = 143; 9. Endogenous ligands: 5.1, n = 165; 10. Basic helix-loop-helix proteins: 4.9, n = 77.
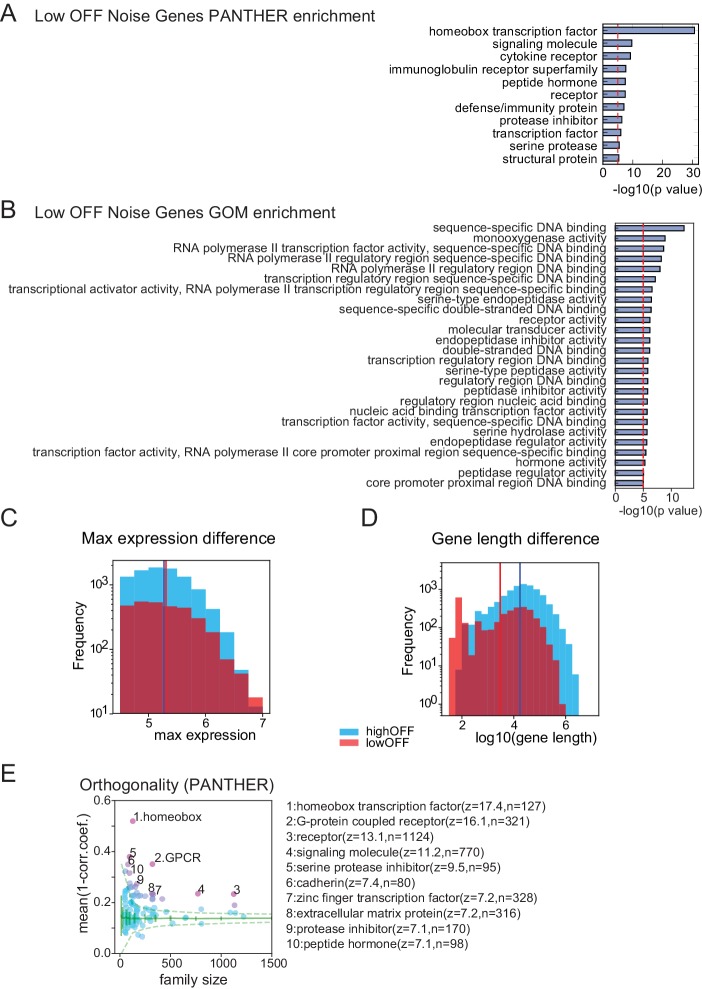
Figure 5—figure supplement 1. Properties of Low OFF noise genes.
Figure 5—figure supplement 2. Homeobox TFs form a combinatorial code.
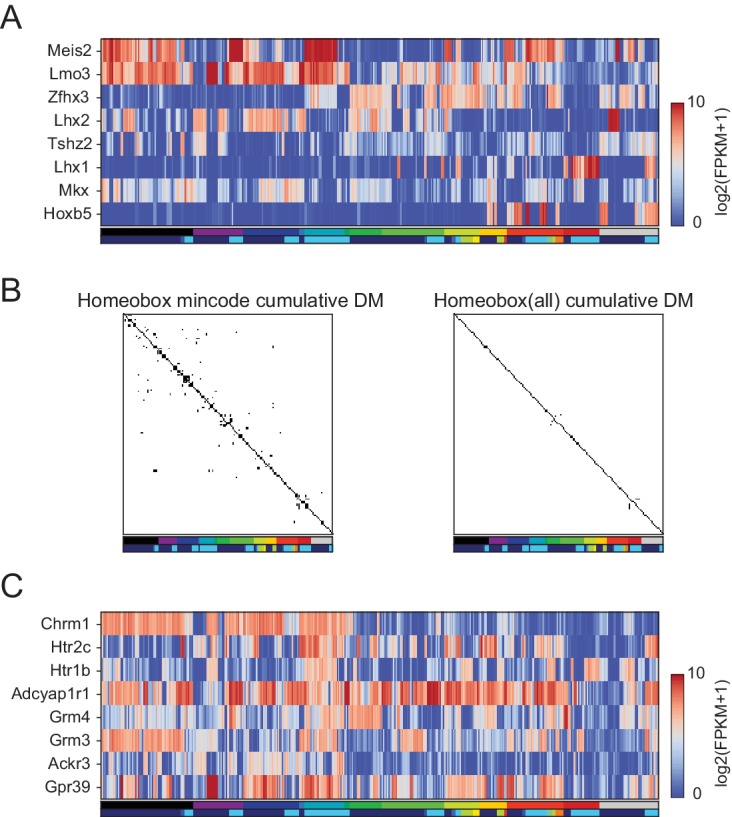
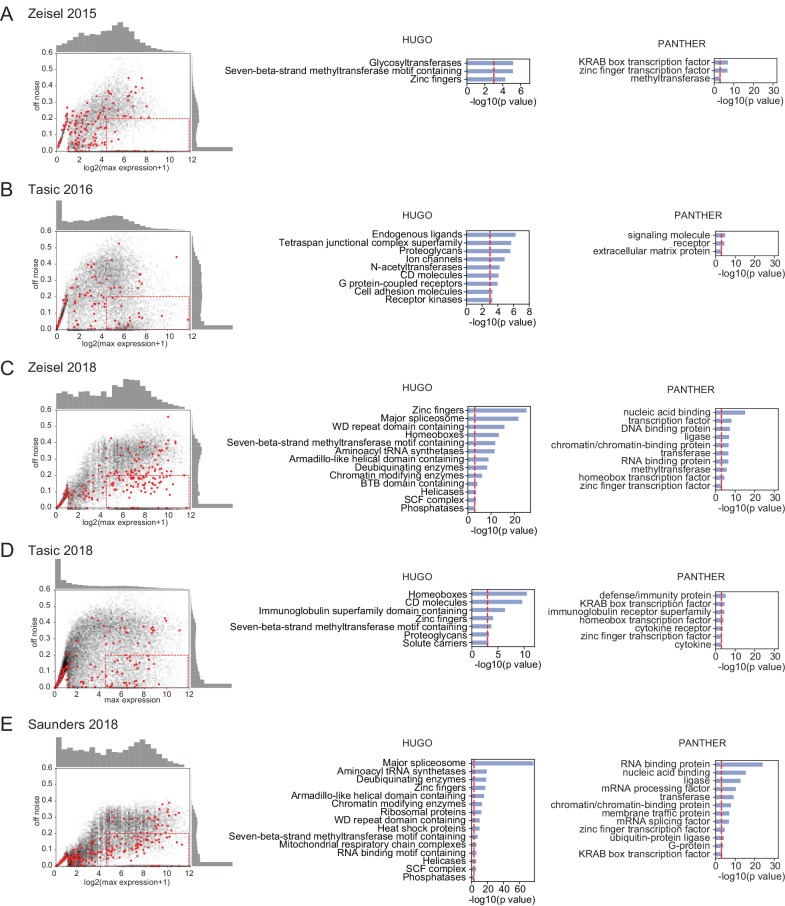
Figure 5—figure supplement 3. OFF noise in single-cell datasets.
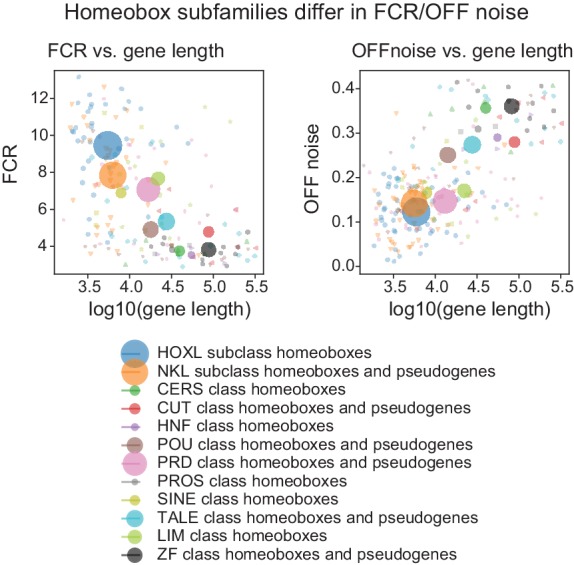
Figure 5—figure supplement 4. OFF noise and gene length in Homeobox subfamilies.
