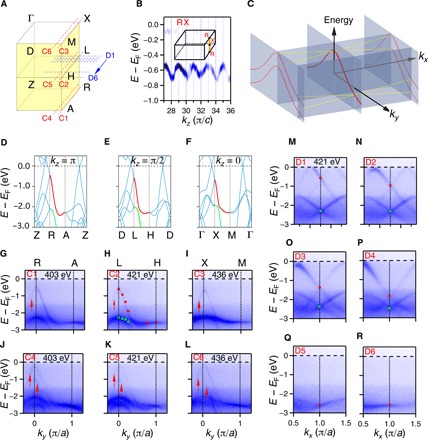
Fig. 2. Electronic structures of the nodal surfaces of ZrSiS.

(A) Schematic of momentum locations of cuts C1 to C6 and D1 to D6 in the bulk BZ. (B) Intensity plot of second derivatives of the ARPES data along X-R measured in a range of hν from 405 to 730 eV. (C) Schematic plot of the band structure in an arbitrary kx-ky plane near the nodal surface. Thick and thin red curves represent the degenerate band on the nodal surface and the nondegenerate bands away from the nodal surfaces, respectively. Yellow lines represent the bands with Dirac-like crossing in the normal direction of the nodal surface. (D to F) Calculated bulk bands at kz = π, π/2, and 0, respectively. The red and green lines indicate the degenerate bands on the BZ boundary. (G to L) Band dispersions along cuts C1 to C6, respectively. Arrows in (J) to (L) indicate the band splitting when the cuts deviate off the BZ boundary. (M to R) Band dispersions along cuts D1 to D6, respectively. Red and green dots in (M) to (R) indicate the band crossings, whose positions in the degenerate bands are marked in (H).
