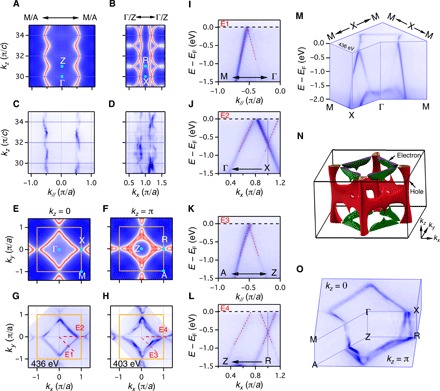
Fig. 3. Electronic structures of the Dirac nodal lines of ZrSiS.

(A and B) Calculated FSs in the Γ-M-A-Z and Γ-X-R-Z planes, respectively. (C and D) Experimental FSs in the Γ-M-A-Z and Γ-X-R-Z planes, respectively, measured in a range of hν from 466 to 691 eV. (E and F) Calculated FSs in the kz = 0 and π planes, respectively. (G and H) Experimental FSs in the kz = 0 and π planes measured with hv = 436 and 403 eV, respectively. (I to L) Band dispersions along cuts E1 to E4, respectively. (M) 3D intensity plot of the ARPES data measured with hν = 436 eV, showing the band structure of the nodal ring in the kz = 0 plane. (N and O) Calculated and experimental FSs in the 3D bulk BZ, respectively.
