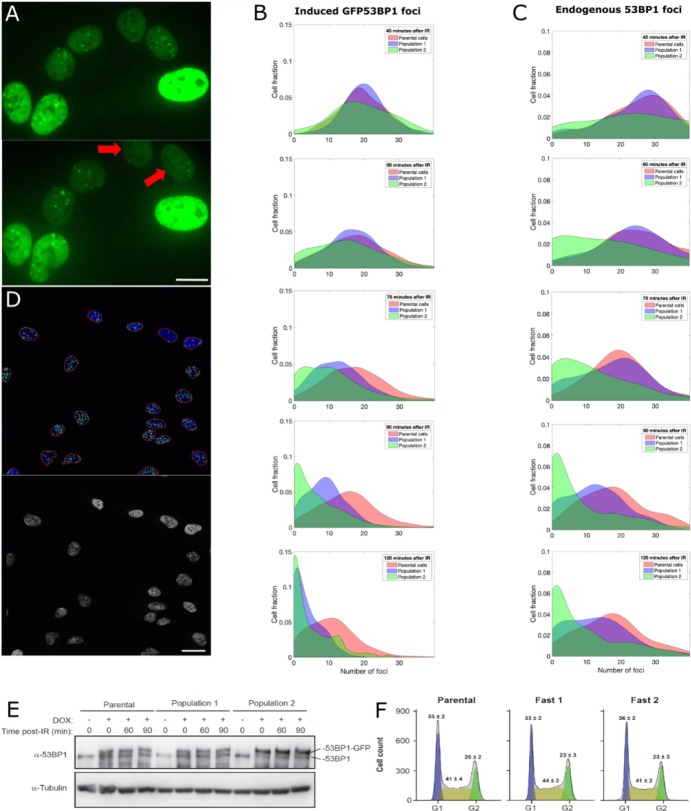
Figure 5. Capture and expansion of individual cells that differ in their capacity to resolve ionizing radiation-induced 53BP1 foci.
(A) Nuclei from irradiated cells 40 min (top) and 90 min (bottom) post-irradiation. Two cells (red arrows) resolved 53BP1 foci more rapidly and were selected for capture. Scale bar: 14 µm. (B, C) Smoothed normalized histograms showing the fraction of cells detected as a function of the number of induced GFP-53BP1 (B) or endogenous 53BP1 (C) foci for five time points. Sorted Populations #1 and #2 resolve foci faster than their parental counterpart as illustrated by the more rapid shift toward the left (zero foci per cell) observed for these two populations. (D) Illustration of automatic nuclei segmentation and detection of foci (top) and source image (bottom). Objects detected as nuclei are circled in red, segmented foci appear as green circles. Scale bar 25 µm. (E) Immunoblot showing the amount of 53BP1 at 0, 60, 90 min post-irradiation in doxycycline induced cells (+) and non-induced cells (-). 53BP1 levels are not altered in Populations #1 or #2 compared to the parental cells. (F) Cell cycle profiles of U2OS GFP-53BP1 parental cell lines and two extracted populations. Cultures were induced with Dox for 48 hr and cell cycle was analyzed by DNA content flow cytometry (see Material and methods). Values represent the means ± SEM of three independent experiments. All focus quantification graphs represent the average of 3 experiments, where in each case at least 200 cells were scored.

