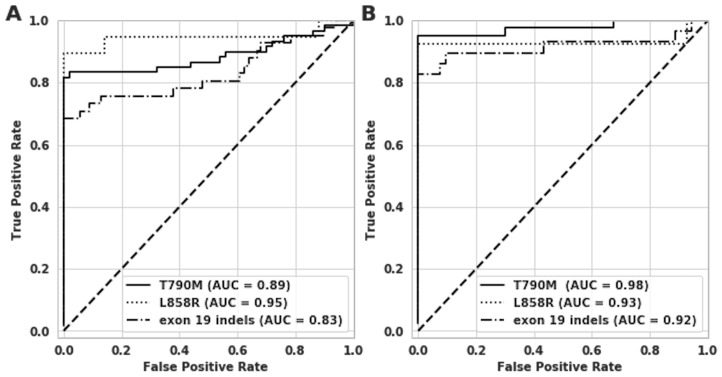
Figure 3. Receiver operating characteristic (ROC) curve analysis on clinical samples for T790M, L858R and exon 19 indels.
The x-axes show 1-Specificity or the False Positive Rate (FPR), and y-axes show the sensitivity or True Positive Rate (TPR). (A) ROC curves for all three assays for all 110 patient samples. (B) ROC curves for all three targets on M1b/MX patient samples alone.

