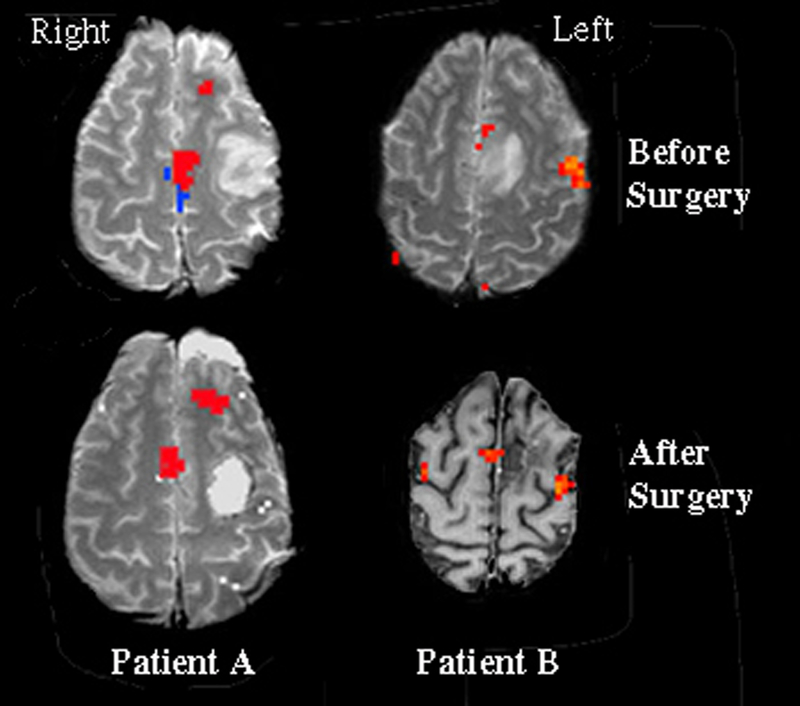
Figure 1.

Statistical activation maps from language tasks were superimposed on T1 weighted anatomical images (Patient B, after surgery image is an inverted grey scale). Surgical resections were of tumorous tissue located in the left frontal lobes. Statistical analysis for Patient A was comprised of a conjunctive analysis, which demarcates only activated regions that were present in both language tasks. Statistical maps for Patient B reflect the activation pattern observed during the object naming task. For both patients, significant activation can be seen in the left speech SMA prior to surgery. However, following surgical resection of the tumorous tissue, the speech SMA was observed to relocate to the contralateral hemisphere. The region in blue represents tongue (or motor) SMA, in contrast with the region in red which represents speech SMA.
