
Figure 2.
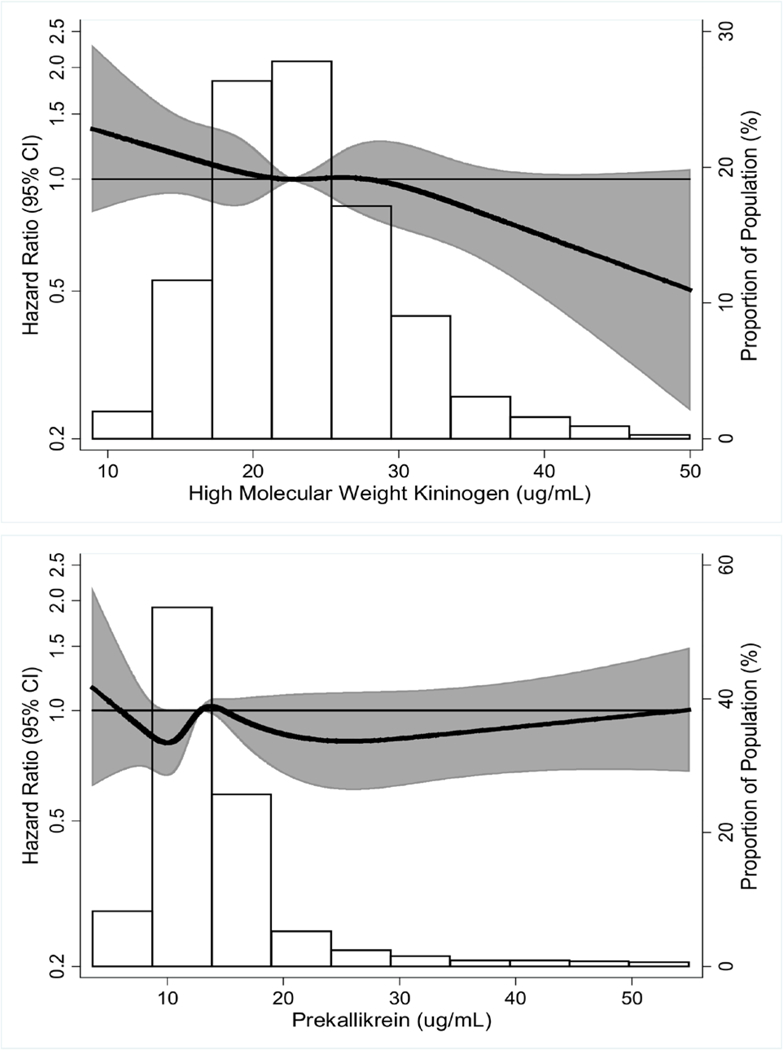
Hazard ratio of venous thromboembolism in relation to plasma high molecular weight kininogen (top) and prekallikrein (bottom).
Footnote: Hazard ratios (dark line) and 95 percent confidence interval (shaded area) were derived from restricted cubic spline models with knots at the 5th, 27.5th, 50th, 72.5th, and 95th percentiles of the distributions (histograms). For ease of presentation, we omitted depiction of the curve at extreme values: HK <5 μg/mL (n=2) or >50 μg/mL (n=12) and prekallikrein <3 μg/mL (n=3) or >55 μg/mL (n=45).