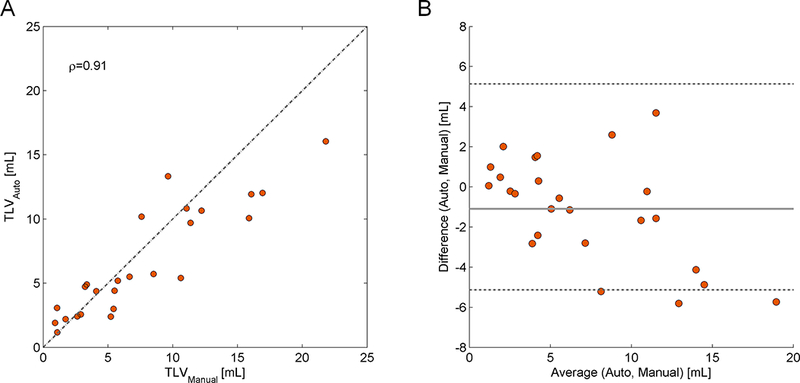
Figure 4 -.

Plots showing the lesion volume estimation performance of the proposed method. Panel A: Total lesion volume (TLV) correlation between the reference and the automated segmentation. The respective Spearman’s rank correlation coefficient (ρ) is given. The dashed line represents the identity (TLVRef=TLVAuto). Panel B: Bland-Altman plot for TLV agreement between manual and automatic segmentations.
