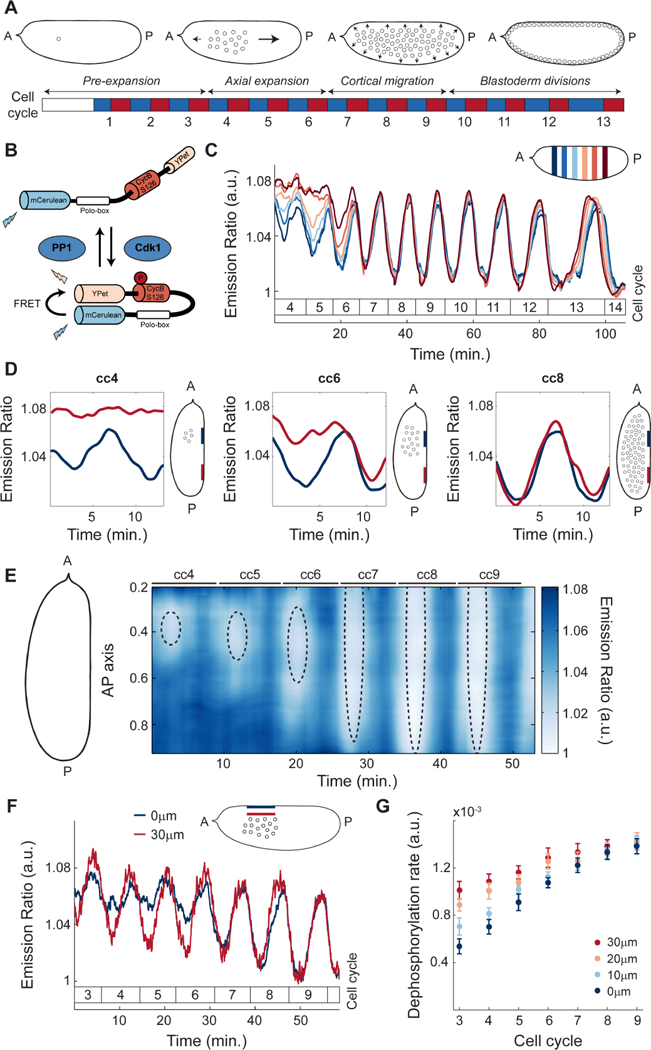
Figure 1. Nuclei provide a spatial landmark for the oscillations of Cdk1 and PP1.

A) After fertilization, the Drosophila embryo undergoes 13 syncytial divisions characterized by four different stages of nuclear movement: pre-expansion (cc1–3), axial expansion (cc4–6), cortical migration (cc7–9), and blastoderm divisions (cc10–13). Embryo diagrams show mid-plane position of nuclear cloud during interphase of cell cycle 1, 6, 8 and 11, respectively. Blue boxes: S-phase; red boxes: mitosis. B) Diagram of Cdk1 to PP1 FRET sensor. C) Emission ratio of Cdk1/PP1 FRET sensor averaged in different regions of the surface of one embryo at cell cycles 4–14. Mitotic exit marks start of a new cycle. Inset, embryo outline with shaded boxes indicating the positions along the AP axis and at the surface of the embryo where the signal was averaged. D) Cdk1 to PP1 activity ratio in anterior (navy) or posterior (red) regions at the surface of an embryo for cell cycles 4 (left), 6 (middle), and 8 (right). Embryo diagrams show mid-plane position of the nuclear cloud as well as regions at the surface (navy and red) where measurements were taken. E) Heat map of Cdk1 to PP1 activity as a function of time along the AP axis of an embryo for cell cycles 4–9. Black dotted ellipses: nuclear cloud border. F) Emission ratio of Cdk1/PP1 FRET sensor for cell cycles 3–9 at embryo surface (blue) and 30μm from the surface (red); p<10−10 (χ2 test). G) Quantification of the dephosphorylation rate of Cdk1/PP1 FRET sensor in different axial planes for cell cycles 3–9. Error bars, sem; a.u., arbitrary units.
