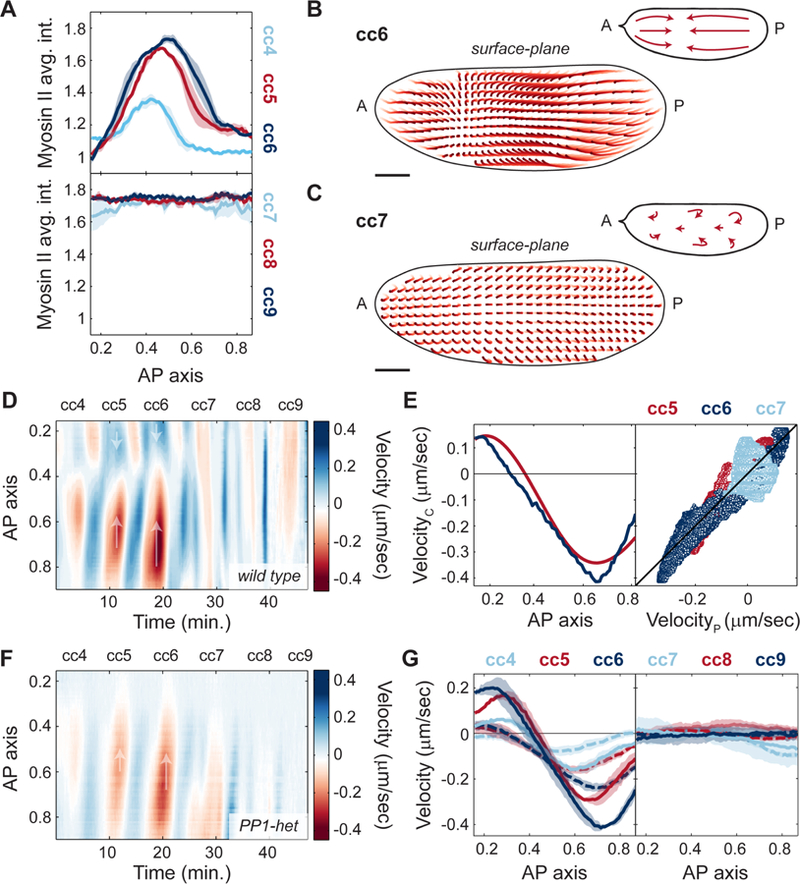
Figure 4. Myosin II gradients drive cortical contractions.

A) Myosin II intensity profiles across AP axis during maximum myosin II recruitment for cell cycles 4–6 (top) and cell cycles 7–9 (bottom). B-C) Cortical flow trajectories (light to dark red) for contraction phase of an embryo during cell cycle 6 (B) and cell cycle 7 (C). Insets, schematic of streamlines showing direction of cortical flows. D) Heat map of cortical flow velocity along the AP axis of an embryo for cell cycles 4–9. Arrows indicate the direction of movement along the AP axis. E) Left: Measured cortical velocity (blue line) for a cycle 6 embryo and predicted velocity (red line) from myosin II gradients. Right: Cortical velocity versus predicted velocity using a gradient-driven flow model for cell cycle 5 (red), 6 (navy blue) and 7 (light blue). Black line: least squares regression line (R2=0.82). F) Heat map of cortical flow velocity along the AP axis of a PP1-het embryo for cell cycles 4–9. Arrows as in D). G) Velocity profiles across AP axis during contraction phases of cell cycles 4–6 (left panel) and cell cycles 7–9 (right panel) for wild type (solid lines) and PP1-het embryos (dashed lines). For cell cycles 4–6, p<10−10 (χ2 test); for cell cycles 7–9, not significant. Shaded regions, sem. Scale bars, 50μm.
