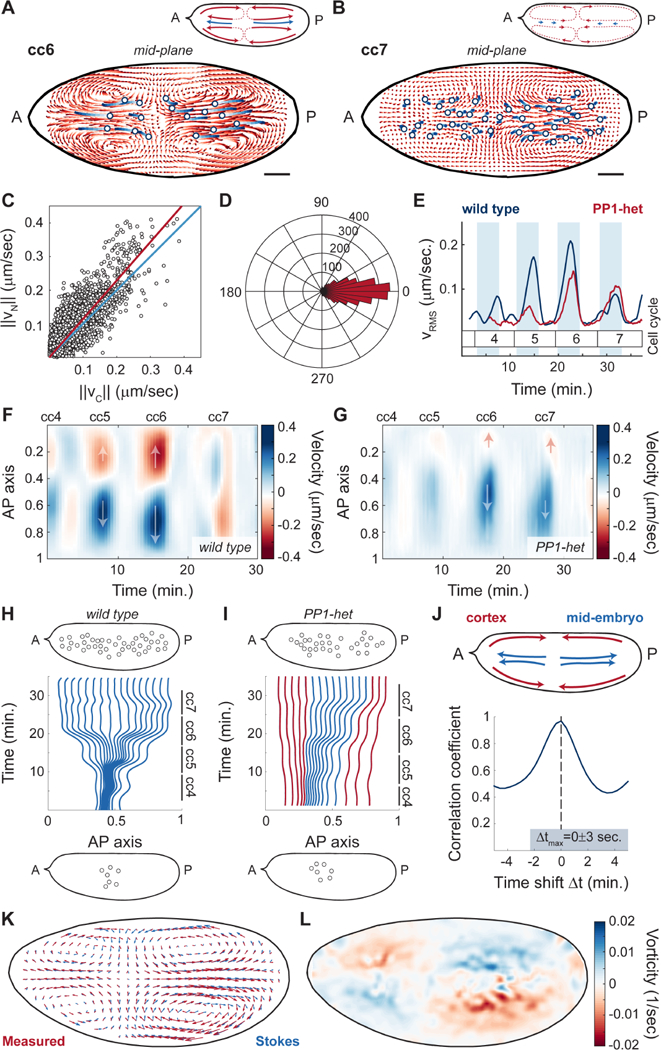
Figure 5. Nuclear movements correlate with cytoplasmic flows.

A-B) Cytoplasmic flow trajectories (light to dark red) and nuclear trajectories (light to dark blue) during interphase of cell cycle 6 (A) and cell cycle 7 (B). Insets, schematic of streamlines showing direction of cortical and cytoplasmic flows (red) and nuclear movement (blue). Scale bars, 50μm. C) Modulus of nuclear versus cytoplasmic flow velocities for embryos in cell cycles 4–7. Blue line: identity line; red line: best fit. D) Histogram in polar coordinates of the angle between nuclear and cytoplasm velocities. E) Root mean square velocity across a wild type embryo (blue) and a PP1-het (red) embryo in cell cycles 4–7. Shaded blue regions: interphase. p<10−10 (χ2 test). F-G) Heat map of cytoplasmic flow in a 50 μm region in the center of a wild type (F) and a PP1-het embryo (G) for cell cycles 4–7. Arrows indicate the direction of movement along the AP axis. H-I) Computationally reconstructed flow trajectories needed for uniform nuclear distribution at the end of cell cycle 7 in a wild type (H) and a PP1-het embryo (I). Blue lines represent trajectories that at cell cycle 4 initiate in the region where nuclei are present, while red lines represent trajectories outside of the nuclear cloud. Top and bottom insets: nuclear distribution in embryos at cell cycle 4 (bottom) and cell cycle 7 (top) from experimental data. J) Cross-correlation analysis of cortical flows and mid-embryo cytoplasmic flows. K) Comparison between the measured flow (red arrows) and the best-fitted Stokes’ flow (blue arrows). L) Heat map showing the vorticity field (ω = ∇ × v) of the measured flow.
