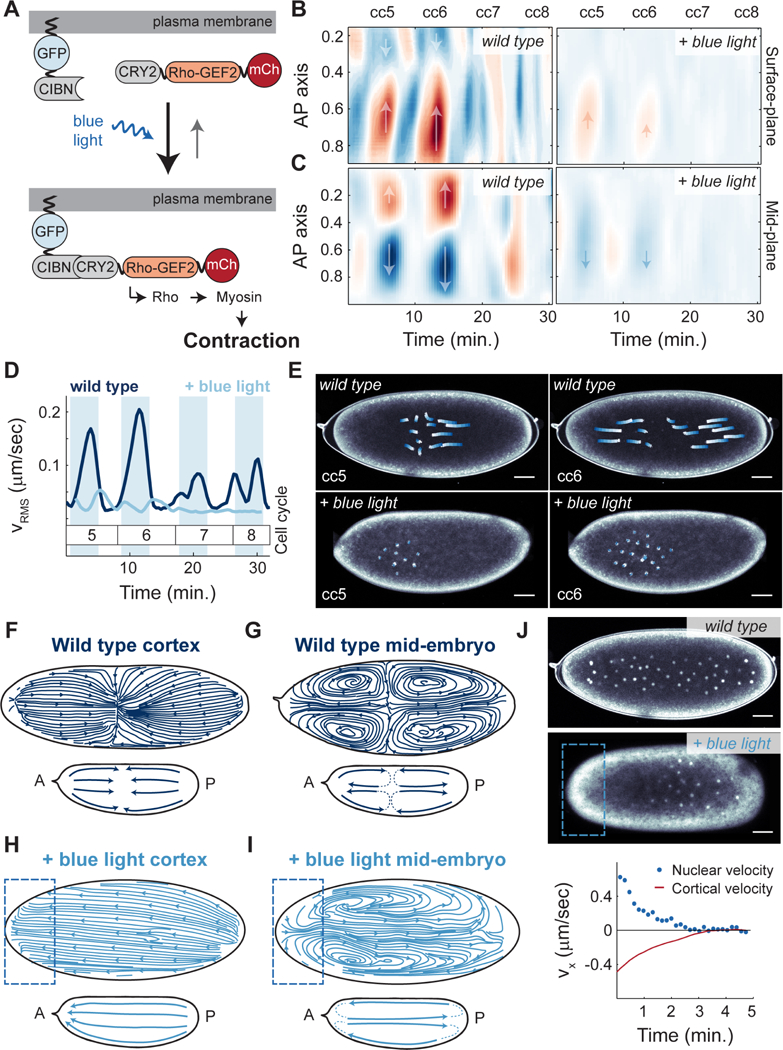
Figure 6. Optogenetic control of Rho signaling shows that cytoplasmic flows and nuclear movements are mainly driven by cortical contractions.

A) Schematic view of the RhoGEF2 optogenetic tool. B) Heat map of cortical velocities in a wild type (top) and embryo expressing RhoGEF2 optogenetic system exposed to constant blue light (bottom) for cell cycles 5–8. Arrows indicate the direction of movement along the AP axis. C) Heat map of mid-embryo cytoplasmic velocities in a wild type (top) and embryo expressing RhoGEF2 optogenetic system exposed to constant blue light (bottom) for cell cycles 5–8. Arrows as in B). D) Root mean square cytoplasmic velocity of a wild type embryo (navy blue) and an optogenetic RhoGEF2 embryo exposed to blue light (light blue). Shaded blue regions: interphase. E) Nuclear trajectories (white to blue) for contraction phase of a wild type (top) or optogenetic RhoGEF2 embryo exposed to blue light (bottom) during cell cycle 5 (left) and cell cycle 6 (right). F-G) Streamlines showing direction of cortical (F) or cytoplasmic (G) flows in a wild type embryo during cell cycle 6. Inset, summary diagram of flows. H-I) Streamlines showing direction of cortical (H) or cytoplasmic (I) flows in an optogenetic RhoGEF2 embryo that was activated with blue light on the anterior pole. Inset, summary diagram of flows. J) Top two panels: Nuclear distribution for a wild type (top) and a pole-activated embryo (middle) at cell cycle 7 expressing PCNA-TagRFP to mark nuclei. Bottom panel: average cortical velocity during one contraction phase (red line) with corresponding nuclear velocity (blue points) of an optogenetic RhoGEF2 embryo activated on anterior pole. Scale bars, 50μm.
