
Figure 1. Generic Health Status Scores Over 24 Months.
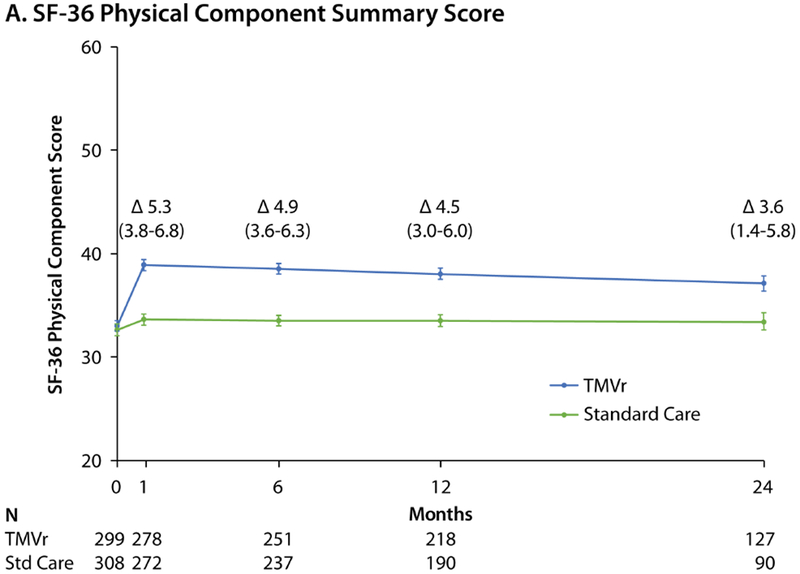
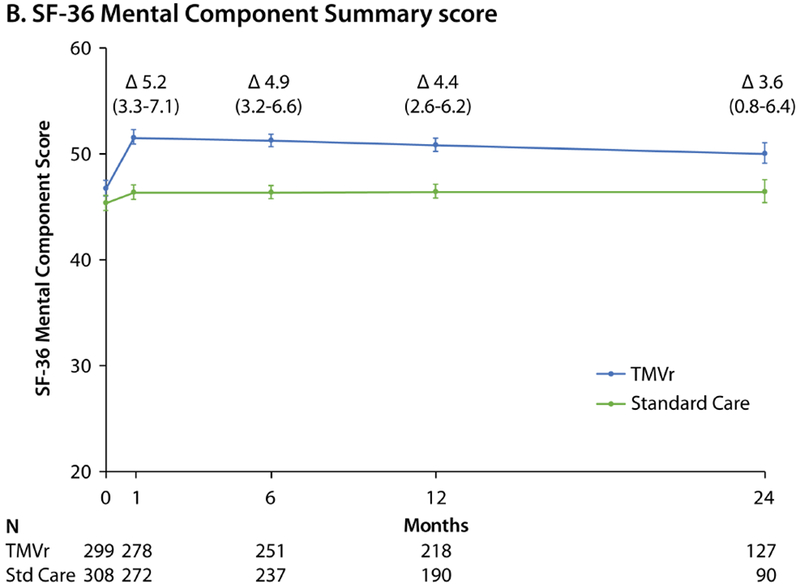
Predicted mean values with standard errors, as derived from piecewise linear regression models taking into account all available health status scores. Δ values represent mean between-group treatment difference and 95% CI. A. Short Form-36 Physical Component Summary score. B. Short-Form-36 Mental Component Summary score. Reductions in patient numbers in year 2 are due to a combination of death and administrative censoring.