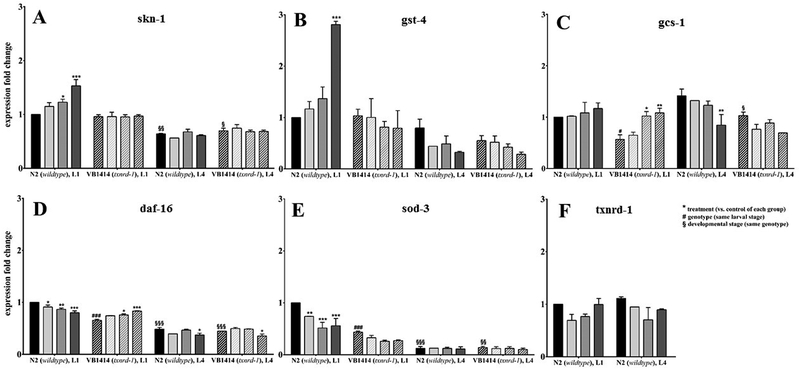
Figure 4.
mRNA expression levels of antioxidant genes following hatch incubation (18 h) with the Se species (100 μM). Relative gene expression was determined by qRT-PCR. Shown are mean values + SEM of two independent experiments in duplicates. Data are normalized to the untreated wildtype at L1 stage and relative to afd-1/β-actin. Statistical analysis using two-way ANOVA: treatment (vs. untreated control of respective group) *p < 0.05, **p < 0.01, ***p < 0.001, genotype (vs. wildtype control of the same larval stage) #p < 0.05, ###p < 0.001, developmental stage (vs. L1 of respective strain) §p < 0.05, §§p < 0.01, §§§p < 0.001.  control,
  selenite,
  SeMet,
  MeSeCys.

