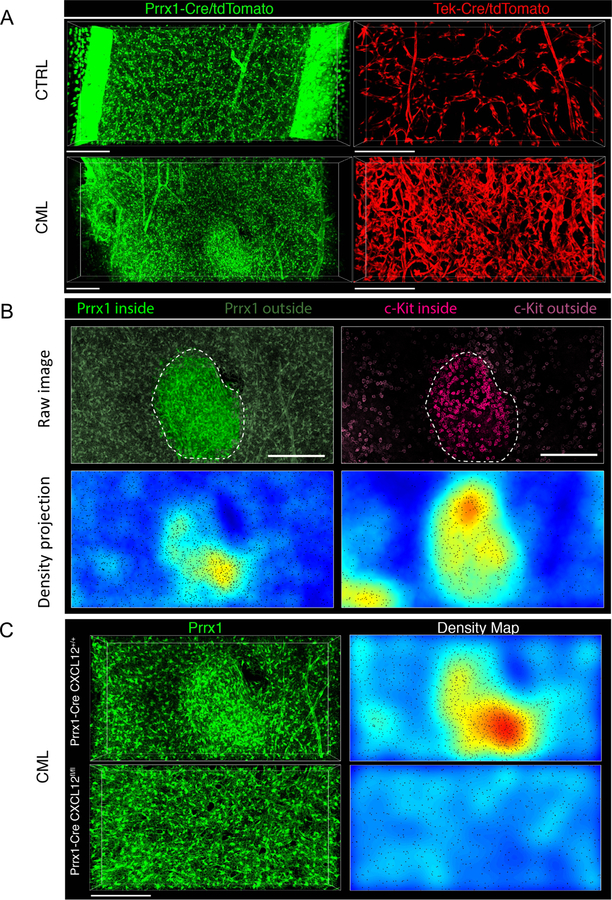
Figure 4. CXCL12 deletion prevents formation of MSC clusters in CML BM with colocalization of leukemic progenitors.
Representative 3D confocal images of femoral BM volumes of Prx1-Cre+ Rosa26-tdTomatof/f (green) and Tek-Cre+ Rosa26-tdTomatof/f (red) mice transplanted with FACS sorted α-cat-GFP+ c-Kit+ cells from either normal (CTRL) or CML mice (CML) 8 weeks post-transplant. (A). Abnormal clusters of Prx1-Cre+ MSC appear in the BM during progression of CML (left panels: depth, 90 µm; size, 1429 µm*549 µm; scale bar, 200 µm; right panels: depth, 64 µm; size, 800 µm*400 µm; scale bar, 200 µm). CML progression has massive effects in BM microvascular structure compared to normal BM (right panels). A conspicuous increase in microvascular density, a loss of the typical sinusoidal morphology and prominent signs of vascular remodeling are apparent. (B) 3D images and tissue maps of typical MSC cluster and aggregation of c-Kit+ leukemic progenitors (magenta) inside and in the vicinity of these structures (delimited by dashed lines and highlighted) (top image: depth, 90.4 µm; size, 517 µm*526 µm; scale bar, 200 µm) (C) Representative images of MSC (green) in Prx1-Cre+ CXCL12+/+ (upper panel) and Prx1-Cre+ CXCL12fl/fl bones (lower panel) with CML, which shows normal homogeneous distribution of MSC and absence of clusters when CXCL12 is deleted from the mesenchymal Prx-1-Cre+ fraction (top left panel: depth, 107 µm; size, 800 µm*400 µm; scale bar, 200 µm; bottom left panel: depth, 64 µm; size, 800 µm*400 µm; scale bar, 200 µm). Right images show tissue density maps of MSC corresponding to BM volumes imaged in left panels. Automated microscopy images correspond to stitching of adjacent fields. See also Figure S6.

