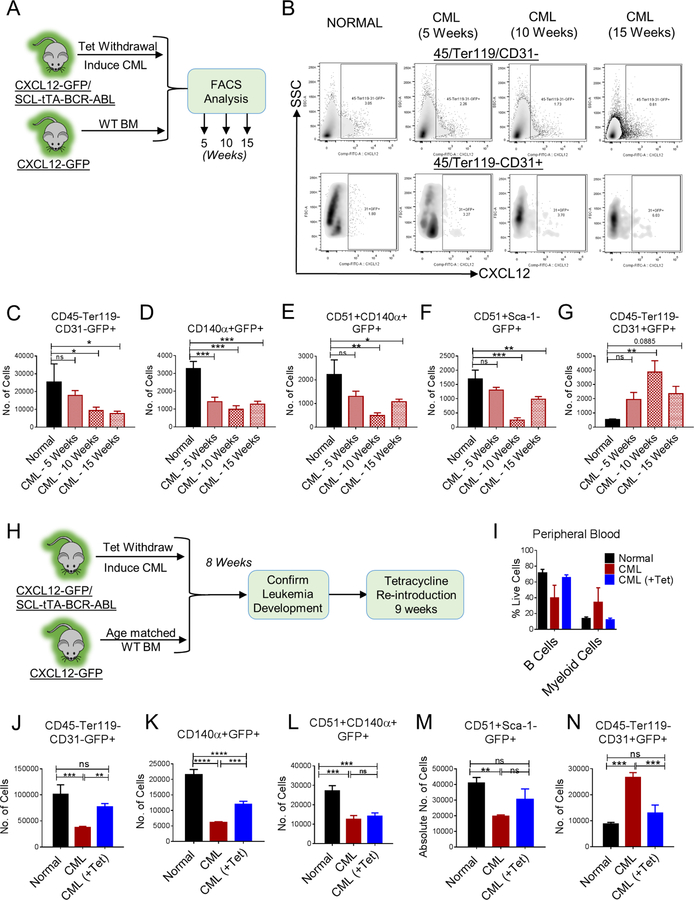
Figure 7. CML development leads to altered distribution of CXCL12-expressing cells in murine BM.
(A) Age and sex matched CXCL12-GFP knock-in mice (Normal) and CXCL12-GFP-SCL-tTA-BCR-ABL mice (CML) were subjected to tetracycline withdrawal. Mice were euthanized and FACS analysis for BM microenvironmental cells was performed every 5 weeks until 15 weeks (n=4–5 mice/group). FACS plots for CXCL12-expressing stromal (45-Ter119-CD31-) and endothelial cells (45-Ter119-CD31+) during CML development are shown (B). The number of CXCL12-expressing stromal cells (CD45-Ter119-CD31-GFP+) (C), CXCL12-expressing PDGFRα+ cells (CD45-Ter119-CD31-CD140α+GFP+) (D), CXCL12-expressing osteoprogenitors (CD45-Ter119-CD31-CD51+CD140α+GFP+) (E), CXCL12-expressing osteoblasts (CD45-Ter119-CD31-CD51+Sca-1-GFP+) (F), and CXCL12-expressing endothelial cells (CD45/Ter119-CD31+GFP+) (G) per femur are shown. Error bars represent mean ± sem. Significance values. ns (non-significant) P>0.05, *P< 0.05, **P< 0.01, ***P<0.001, ****P<0.0001. (H) Age and sex matched CXCL12-GFP knock-in mice (Normal) and CXCL12-GFP-SCL-tTA-BCR-ABL mice (CML) were subjected to tetracycline withdrawal for 8 weeks to induce leukemia. Then, a cohort of CML mice were placed back on tetracycline for further 9 weeks (CML+Tet). (I) Multilineage blood profile showing restoration of normal hematopoiesis upon tetracycline re-introduction. Mice were euthanized and FACS analysis was performed on BM (n=3–4 mice/group). The number of CXCL12-expressing stromal cells (CD4-Ter119-CD31-GFP+) (J), CXCL12-expressing PDGFRα+ cells (CD45-Ter119-CD31-CD140α+GFP+) (K), CXCL12-expressing osteoprogenitors (CD45-Ter119-CD31-CD51+CD140α+GFP+) (L), CXCL12-expressing osteoblasts (CD45-Ter119-CD31-CD51+Sca-1-GFP+) (M), and CXCL12-expressing endothelial cells (CD45-Ter119-CD31+GFP+) (N) per femur are shown. Error bars represent mean ± sem. Significance values. ns (non-significant) P>0.05, *P< 0.05, **P< 0.01, ***P<0.001, ****P<0.0001.

