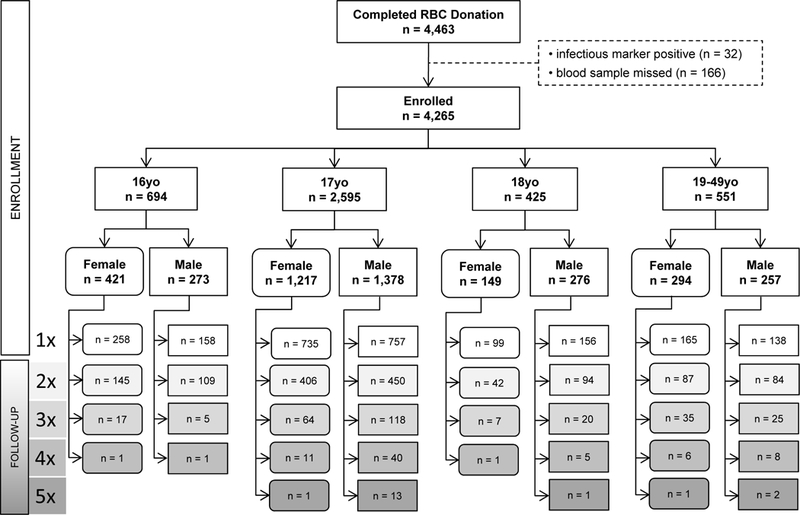
Figure 1: CHILL study flow diagram.

Number of eligible donors by age (years completed) and sex at enrollment, with total donation count during CHILL (where “Nx” represents N successful donation procedures with 1 or 2 red cell units donated per procedure). Ferritin values were available from all 4,265 enrollment donations and from 1,954 of 2,290 follow-up donations.
