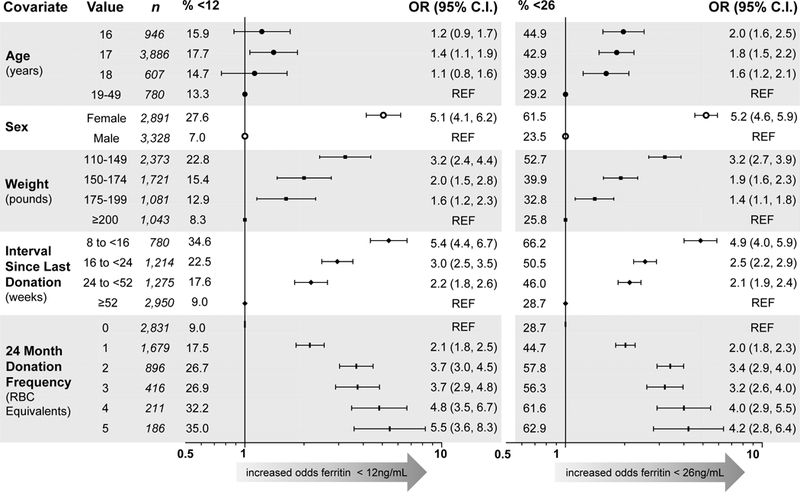
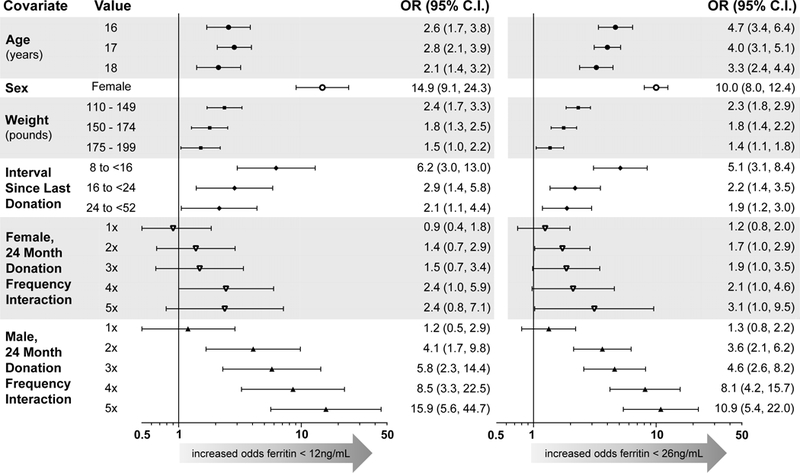
Figure 4: Prevalence of and risk for ferritin <12 ng/mL or <26 ng/mL across 6219 study visits.


A) Unadjusted odds ratios for ferritin <12 ng/mL (left) and <26 ng/mL (right). Reference for Age is 19–49; for Sex is male; for Weight is ≥200 pounds; for Interval Since Last Donation is ≥52 weeks; for 24-Month Donation Frequency is 0. “n” represents the number of donations from subjects at each level of the modeled covariates, and “% <12” and “% <26” represent the proportion of donations at each level below the respective ferritin cutoff. B) Adjusted odds ratios for ferritin <12 ng/mL (left) and <26 ng/mL (right) in repeated measures multivariable logistic regression. Reference group is 19–49 yo male with 0 RBC donations in 24 months and weight ≥200 pounds; prevalence of ferritin <12 ng/mL is 0% and <26 ng/mL is 2%. Double red blood cell donation as most recent phlebotomy and blood center were also included in both models, but were not statistically significant and are not shown.
