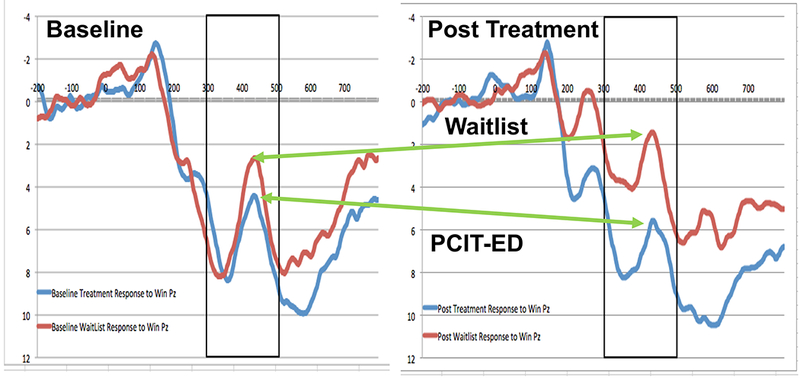
Figure 1. Reward Positivity at Baseline and Post Treatment:

ERP waveforms at Pz to win outcomes at baseline (graph on the left) and post treatment (graph on the right). The blue lines are responses in the PCIT-ED treatment condition and the red lines are responses in the Wait List Control condition. Voltages are plotted with the more negative values at the top of the graph, as is the frequent convention in ERP reports.
