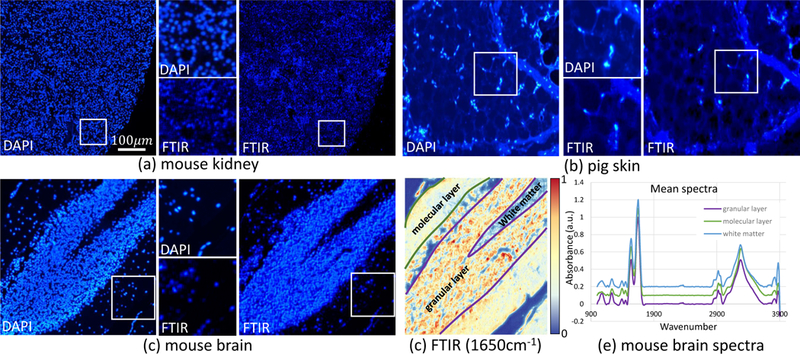
Figure 5.

Digital DAPI staining of (a) mouse kidney, (b) pig skin, and (c) mouse brain respectively using our CNN framework. Digitally stained FTIR images are shown on the right, with close-ups on the bottom. (d) FTIR absorbance image at 3300 cm−1 indicating the regions used to collect average spectra. (e) Mean spectra were extracted using SIproc56 from masks of the molecular layer (green), granular layer (purple), and white matter (blue) of the cerebellum. Spectra are baseline corrected, normalized to Amide I, and offset for clarity.
