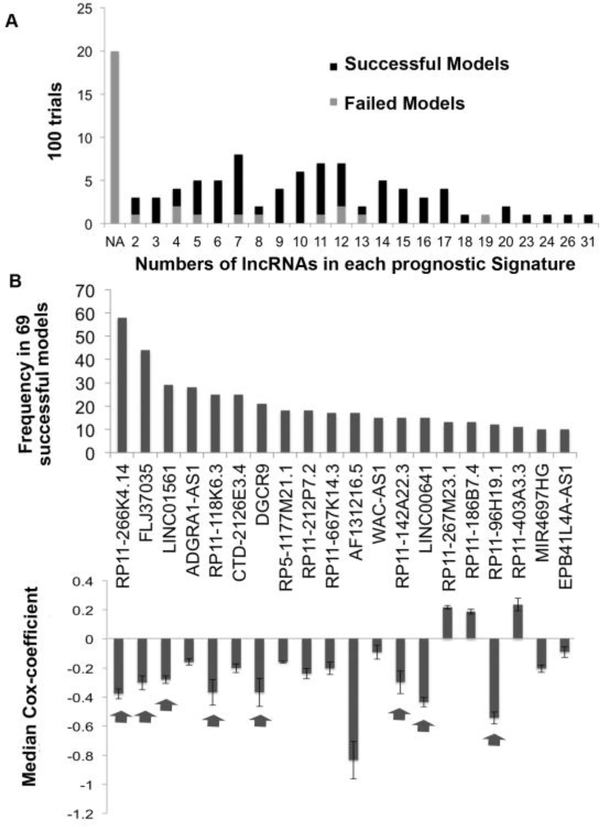
Figure 2. Selection of lncRNAs with best predictors of outcome.
A) Barplot showing number of lncRNAs that predicted outcome in the training set in 100 trials. The successful models were those that also predicted outcome in the testing set. NA: no lncRNA predicted outcome in training set. B) Barplot showing number of times each of the top 20 lncRNAs (out of 167) were present in successful survival models (significant in testing set). The lower panel shows median Cox-coefficient (after lasso penalization) and the variance of the cox-coefficient for each of the above 20 lncRNAs from the successful models where they were selected. The arrow points towards lncRNAs selected for UVA8.

