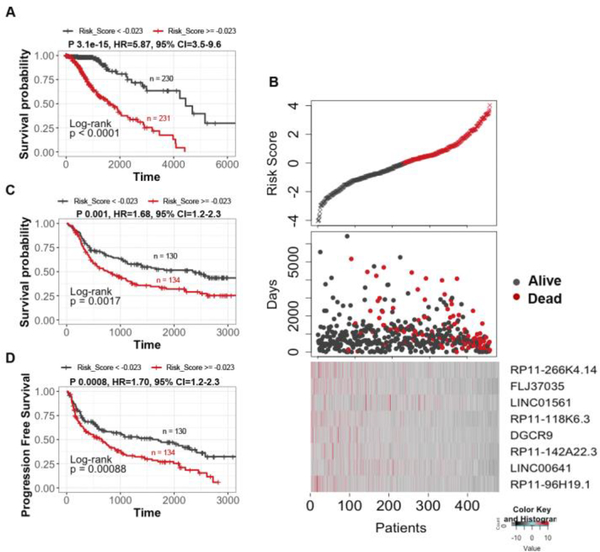
Figure 3. Survival analysis of the patients divided by the prognostic lncRNAs in two data sets.
A) Patients in the entire TCGA dataset with risk score greater than median score of −0.023 show poor survival compared with patients with risk score less than median risk score. B) Upper panel: Plot showing patients sorted based on UVA8 risk score with black representing patient with risk score below median and red showing those with risk score above median. Middle panel: Number of days of survival indicated on Y-axis of patients sorted on the X-axis based on the risk scores in the top panel and alive/dead status indicated by color. Bottom panel: z-score transformed expression value of lncRNAs in UVA8 show higher expression in patients with low risk score. C) Kaplan Meier plot of overall survival of patients in CGGA dataset with risk score greater than (red) or less than (black) median risk score of TCGA dataset. D) Kaplan-Meier plot for progression free survival in CGGA dataset showed poor survival for patients with high-risk score. Rest as in C.

