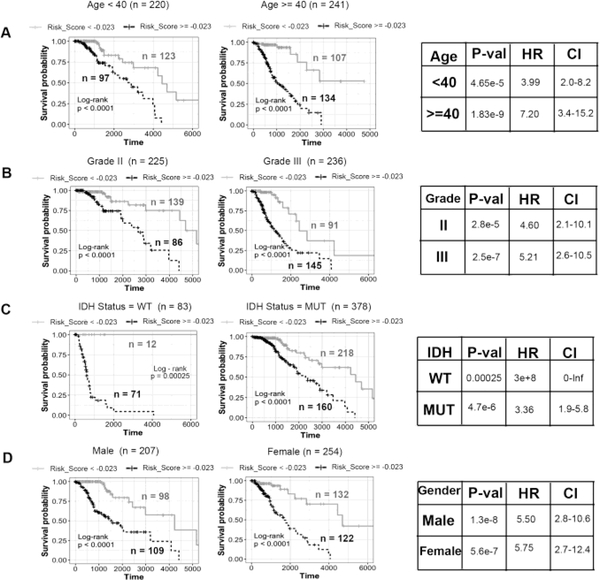
Figure 4. Stratification analysis by different clinical variables.
Kaplan-Meier curve analysis of overall survival in high- and low-risk groups for A) younger (Age < 40) and older patients (Age >= 40). B) Grade II and Grade III patients C) IDH mutation status as WT and mutation (MUT) patients D) Male and Female patients. Black dashed line: patients with high risk score, Gray solid line: patients with low risk score. The tables on the right show log-rank p-value, hazard ratio and 95% confidence interval for each Kaplan-Meier plot.

