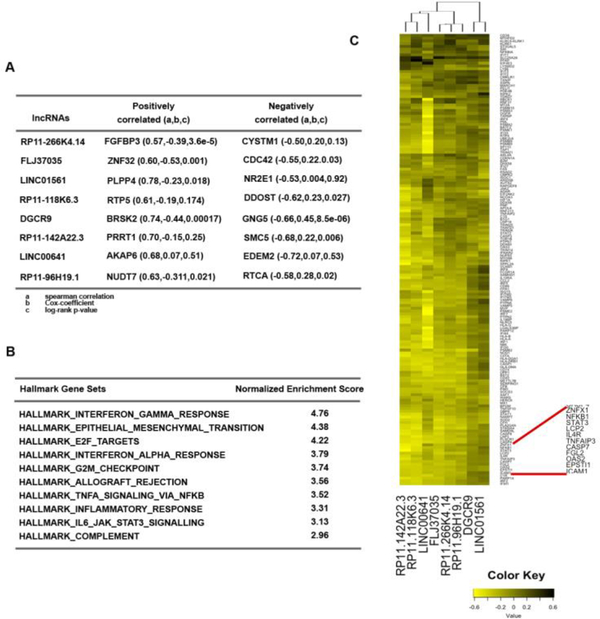
Figure 6. Guilt-by-association analysis of the 8lncRNAs in UVA8.
A) Correlation and Cox-regression coefficient for the mRNAs that are most correlated (positive and negatively) with each of the lncRNAs in UVA8. a, b and c defined below the table. B) List of pathways that are most enriched in protein-coding genes that are negatively correlated with the UVA8 lncRNAs. C) Heatmap showing correlation of different genes in the interferon-gamma response gene set (rows) to the lncRNAs in UVA8 (columns).

