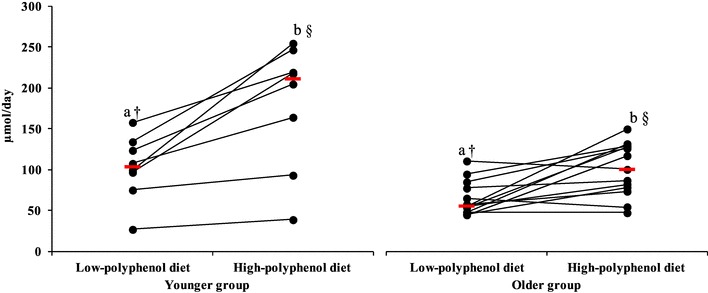
Fig. 3.

24-hour urinary phenolic acid profile excretion without hippuric acid (µmol/day) after low- and high-polyphenol diets in younger (n = 8) and older (n = 13) participants. Each circle indicates the measurement of the urinary phenolic acids profile without hippuric acid for each participant after low- and high-polyphenol diets. Median urinary phenolic acids profile without hippuric acid for each group is indicated by a red horizontal line. a,b symbols indicate differences within group (LPD to HPD; younger: p = 0.003; older: p = 0.007). †Symbol indicates differences between groups (LPD vs. LPD; p = 0.03). §Symbol indicates differences between groups (HPD vs. HPD; p = 0.02)
