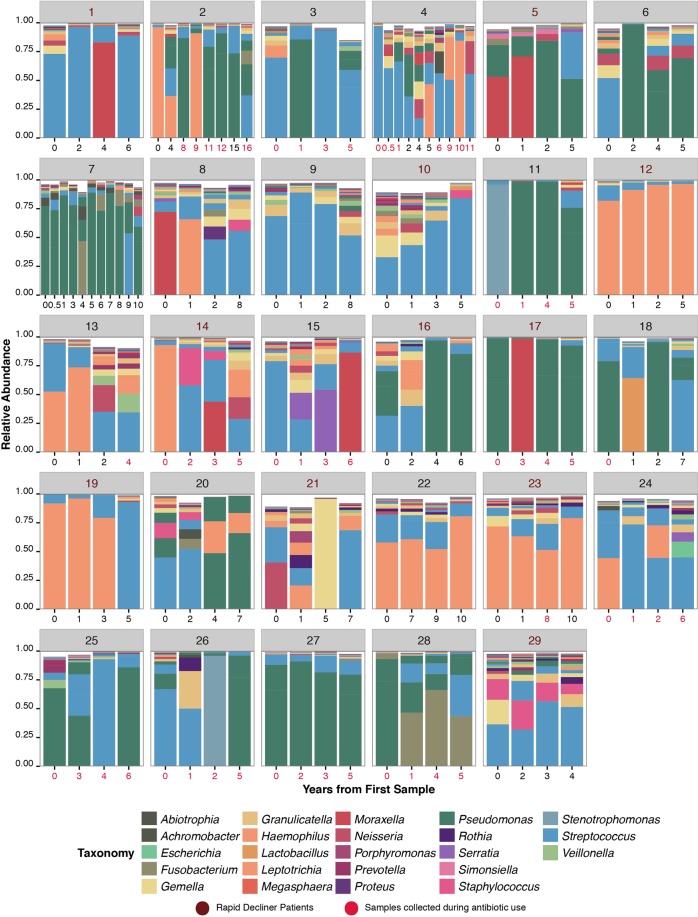
Figure 1.
Taxonomic summaries of OTU present in >1% relative abundance of all samples (n = 133) obtained from a cohort of 29 nCFB patients as a function of the years from first sample. Samples for each patient are grouped together by a unique patient identifier – as indicated by the grey heading. Patient’s numbers from the Decliner group are indicated in magenta. Analysis of the taxonomic summary reveals a unique microbiome associated with each patient and varying degrees of inter and intra-patient diversity. Samples collected under antibiotic pressure are indicated by red text indidcating year of collection.

