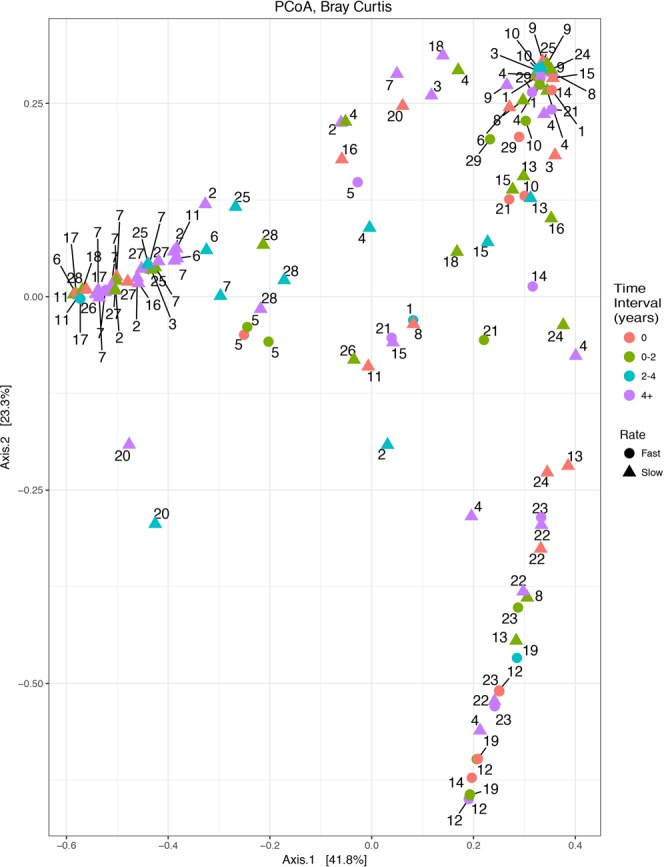
Figure 2.

Clustering of samples by patient during stable periods (excluding exacerbation events) was observed (n = 121). Samples obtained from each patient are designated by the patient number adjacent to each point. Samples were categorized by color based on the time since baseline sample. Patients classified as Decliners are indicated by a circle, whereas patients with a Stable course are represented by triangles. Significant clustering was observed using PERMANOVA analysis (p = 0.03).
