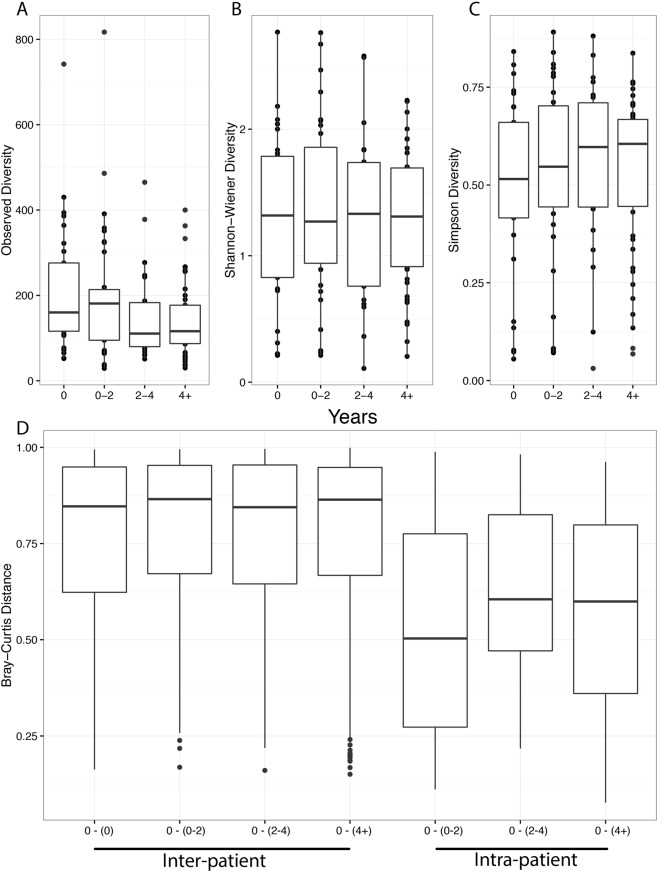
Figure 3.
The microbial community was observed to remain relatively constant over the study period as measured by Observed OTUs (A), Shannon-Wiener (B) and Simpson diversity (C), and Bray-Curtis dissimilarity (D). Samples were categorized based on the time interval relative to first sample as: 0 (n = 29), 0–2 years (n = 36), 2–4 (n = 22), and 4 + (n = 46) years since initial sample collection. The median and interquartile ranges (IQR) are represented by the middle, top, and bottom lines of each boxplot. No statistically significant comparisons were observed.

