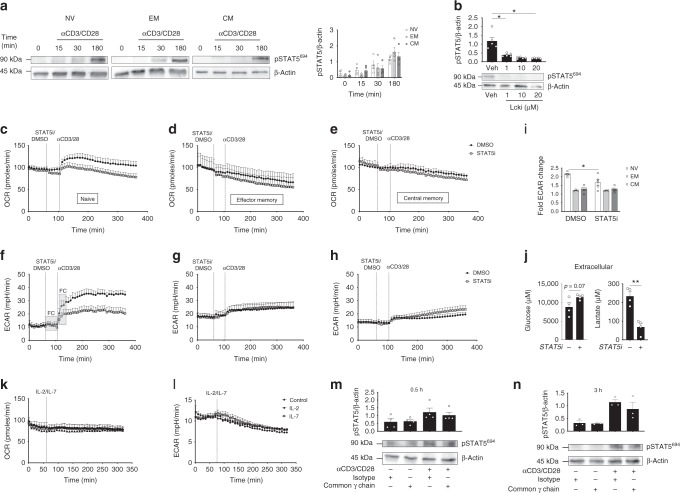
Fig. 5.
STAT5 orchestrates the metabolic switch in activated NV T-cells. a Immunoblot for pSTAT5 Tyr694 and β-actin in NV, EM and CM T-cells following 0, 15, 30 and 180 min of activation with anti-CD3/CD28. Densitometry of pSTAT5 Tyr694. b Immunoblot for pSTAT5 Tyr694 and β-actin in NV T-cells activated with anti-CD3/CD28 in the presence (1, 10 and 20 μM) or absence (Veh) of a lck inhibitor. OCR (c–e) and ECAR (f–h) was measured in NV (c, f), EM (d, g) and CM (e, h) CD4+ T-cells in the absence (DMSO) or presence of a STAT5 inhibitor (100 μM) before cells were activated with anti-CD3/CD28 at the indicated time points. i Fold change in ECAR upon activation calculated using the measures in the FC box. j Extracellular glucose and lactate production in activated NV T-cells (anti-CD3/CD28) in the absence or presence of STAT5i (100 μM) for 4 h. OCR (k) and ECAR (l) of NV T-cells activated with either IL-2 or IL-7 (10 ng/mL). Immunoblot of pSTAT5 Tyr694 and β-actin in NV T-cells activated with anti-CD3 (2 μg/mL) and anti-CD28 (20 μg/mL) with common γ chain antibody or isotype control (1 μg/mL) for m 0.5 or n 3 h. Statistical analysis was performed using a non-matching two-way ANOVA with Sidak’s multiple comparison test (a, i), a paired t- test (j) or a matched Friedman test with Dunn’s multiple comparisons test (m, n). Data are representative of a 3–5 experiments with one representative immunoblot sample of 3–5 is shown, five (b, c, e, f, h), three (d, g, n), four (j, m) or two independent experiments (k, l) and expressed as mean ± SEM; *p ≤ 0.05, **p ≤ 0.01

