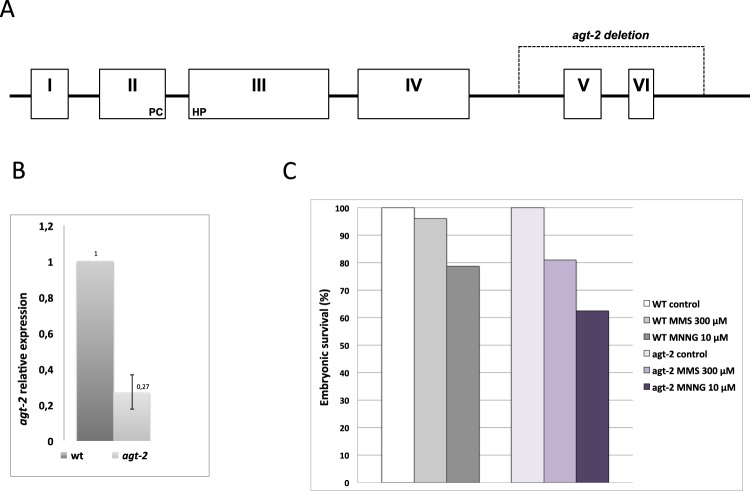
Figure 2.
(A) Schematic representation of the agt-2 gene structure. Exons are indicated by numbered boxes and introns by black lines. Residues PHCP of the catalytic site (exons II and III) are indicated. The dashed line span exons V and VI represents the portion deleted in the mutant agt-2(tm6462) allele. (B) Analysis of agt-2 gene expression in the N2 background by real-time RT–PCR. Data were normalized to the expression level of the pmp-3 housekeeping gene as previously described35 and expressed as the relative mRNA level compared with the average expression level in wild type animals. The mean of three independent experiments from two biological replicates is shown. (C) Effect of alkylation damage on wild type and agt-2 mutant worms. L4 worms were treated with either MMS or MNNG at the indicated concentrations. Embryonic viability 48 hrs after DNA damage treatment was plotted as a percentage of the hatching normalized by that in untreated worms of each genotype. Number of scored P0 worms: untreated wild type = 9; MMS-treated wild type = 18; MNNG-treated wild type = 18; untreated agt-2 = 18; MMS-treated agt-2 = 18; MNNG-treated agt-2 = 18. (chi-squared test: WT-MMS vs agt-2 MMS P < 0.001; WT-MNNG vs agt-2 MNNG P < 0.001).

